The food nutrition label is on almost every food item, but it can be confusing in the sense that it doesn’t tell you much about whether something is good or bad for you. The UC Berkeley School of Journalism hosted a challenge for designers and food experts to rethink the label:
We are confused about what and how to eat and so we’re eating too much of the wrong things. In fact, we’re eating too much of everything. Two-thirds of American adults are overweight or obese. The obesity rate among preschoolers has doubled since 1970. Type 2 diabetes has become an epidemic. We want to make it easier to choose healthy food.
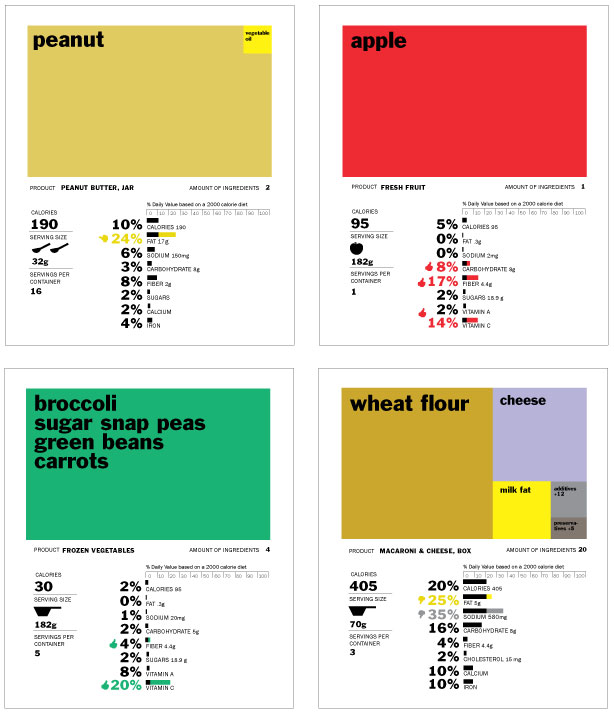
Visual designer Renee Walker won with her rework shown above. The rectangles on top of each label represent main ingredients, and bars on the bottom provide a quick thumbs or thumbs down for a breakdown of fat content, carbohydrates, etc. Icons of spoons and scoops are used to supplement serving size since no one knows what 182 grams looks or feels like.
Practically speaking, it’s hard to imagine anything like this on the back of a Snickers bar any time soon. It requires a certain amount of space to be useful. The sentiment, however, is good and there are useful bits that could be used in a redesign in the future.
How would you improve the existing nutrition label?
[Rethink the Food Label | Thanks, Jeffrey]

 Jonathan Stark, a mobile application consultant, is running an interesting

 Visualize This: The FlowingData Guide to Design, Visualization, and Statistics (2nd Edition)


