The food nutrition label is on almost every food item, but it can be confusing in the sense that it doesn’t tell you much about whether something is good or bad for you. The UC Berkeley School of Journalism hosted a challenge for designers and food experts to rethink the label:
We are confused about what and how to eat and so we’re eating too much of the wrong things. In fact, we’re eating too much of everything. Two-thirds of American adults are overweight or obese. The obesity rate among preschoolers has doubled since 1970. Type 2 diabetes has become an epidemic. We want to make it easier to choose healthy food.
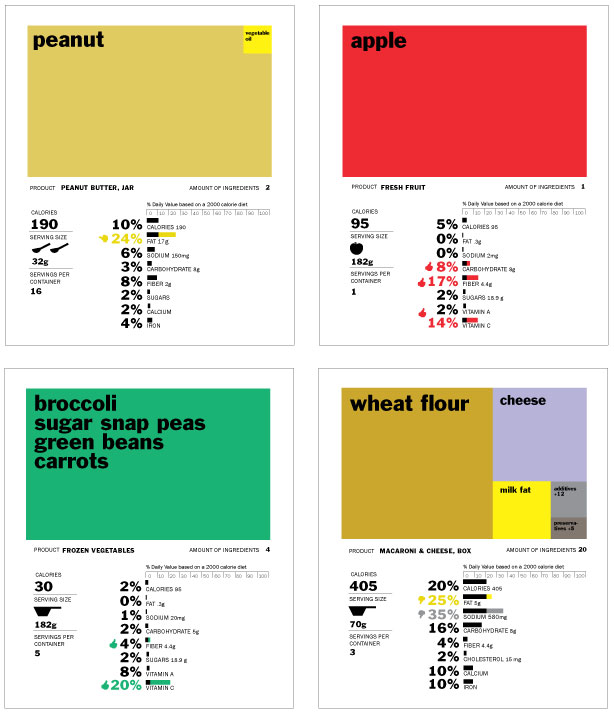
Visual designer Renee Walker won with her rework shown above. The rectangles on top of each label represent main ingredients, and bars on the bottom provide a quick thumbs or thumbs down for a breakdown of fat content, carbohydrates, etc. Icons of spoons and scoops are used to supplement serving size since no one knows what 182 grams looks or feels like.
Practically speaking, it’s hard to imagine anything like this on the back of a Snickers bar any time soon. It requires a certain amount of space to be useful. The sentiment, however, is good and there are useful bits that could be used in a redesign in the future.
How would you improve the existing nutrition label?
[Rethink the Food Label | Thanks, Jeffrey]
 Visualize This: The FlowingData Guide to Design, Visualization, and Statistics (2nd Edition)
This picture is hard to figure out. It would take me hours to get through the grocery store if this was on every box. I don’t know if I could do any better, but I think this is a backwards step from the current label.
I actually find them easier to figure out. I like these new labels much better, in part because they have information that the current labels don’t. Current labels list the ingredients in order based on amount, but they doesn’t tell you how much of each item is in there. They also don’t tell you which nutrients, elements, fats, etc. are good for you and which are bad. As a result most people ignore the labels. This new label has other things going for it too: It’s colorful, it clearly describes the ratio for everything, and it’s extremely easy to find information due to the layout. Look at how easy it is to find calories and serving size, for example.
I guess what I’m saying is, it’s cool to look at but doesn’t present the requisite information quickly and upfront. It invites study. Which is great in some circumstances – who doesn’t love a map?? – but in the store, in the setting of several serial decisions, study is not what is needed – instant communication of what’s in the box is what is needed. Ingredients presented as an ordered list, with the largest ingredient up front, is perfect.
Here, the ingredients are presented proportionally. The actual words are scattered about the space (in the case of multi-category ingredients). Note how much quicker it is to grok the contents of the mixed veggies than it is to grok the contents of mac and cheese. We read left-to-right or top-to-bottom, not spirally-about-a-space. Furthermore, a better way to present the information graphically would be to use a sorted, horizontal bar chart. Faster, easier, direct, (and uninteresting, and that’s ok here).
And the listed percents with huge font-size beside the macronutrients,in smaller font size, is strange to me. I want to see the macro-nutrient first, then the percent. I want to know how much protein, so i look for “protein” and then “percent’. Not the other way around, as it is presented here.
I’m not saying it’s not a cool way to present information. It just seems inappropriate for the circumstances in which it will be used.
@Jason:
I have a different reaction to the ingredient list… presented graphically it’s easier and faster to see and understand, for me. I guess people absorb information differently (might be worthy of a study in that case). However, if I might point out one important deficiency in the above charts, it’s that ingredients with smaller amounts get left off the list. The macaroni, for example, has twenty ingredients but only lists five. That will need to be remedied.
As for the way the percents are displayed, it sounds like your issue can be solved with a layout tweak. No need to scrap the idea on that basis.
I take issue with the value judgements included in this labelling scheme. I really don’t want every food item telling me either “Good job, you’re eating Healthy Food!” or “Bad you, this food is Wrong!” Let me make my own choices about what foods are right for me.
Telling me something is bad when it constitutes 20% of my daily allowance of something and I plan to eat 3 times a day is pretty absurd… same for good really. And critical ingredients are completely missing! Where’t the protein.
I like this. I could see in the future having QR codes on the food packages. Then you could take a picture of the one on your snickers bar or smaller food item with your phone and get the breakdown. I love learning more about my food.
i was thinking the same thing!
Well sure, once that technology becomes ubiquitous. Even the poorest among us has to have access to this information, and right now, I’m not sure how many of them have QR code readers.
Instantlly informative, it’s a shame something like this will inevitably never get adopted!!
Really something to think about. But another even more impactful topic involves drug labels, information about the risks and benefits of drugs, which are difficult to understand for normal people, and which are in dire need of new ideas around info graphics. Fresh ideas needed!
Why not have a QR code that will take each individual person to THEIR preferred style of nutritional label? We need to stop thinking that ONE style of presentation must work for everyone.
Bingo. Good idea.
I don’t understand what the colors in the bar chart are doing. Why are the last 14% of peanut butter fats yellow, but only the last 5% of mac and cheese fats? Similarly, why does peanut butter get a sideways thumb while mac and cheese gets a thumbs down? And why are the broccoli and mac and cheese serving spoon the same size when the servings have a 150% difference?
Speaking from a designer point of view, this is awful. Is that Arial?
Its innovative that you’re using an infographic rather than the boring black and white nutrition label, but I agree with some comments in that its taking a step back.
People who are obese are fully aware that the things they’re eating are bad for them. A thumbs down will not deter anyone from eating something they love.
Taking the time to know what you’re eating is important… to some people. Others really don’t care. A QR would indeed be great for something like this… otherwise, I don’t need to see this on every box.
Here’s how I’d improve the current nutrition label:
make them all available digitally. Then, it’s just a matter of building the systems to match food… to consumer.
Personal plug: I am a data analyst for a BookLamp dot org, and we launch on Tuesday (Aug. 16), so come check us out. We are a startup out of Boise, ID… 3+ years in technical and systems development. Essentially, we measure literature/books. Though our methods are quite a bit different from Pandora, we have been described as a, “Pandora for Books”. Anywho, come check us out on Tuesday!
BookLamp dot org
It should be “Number of Ingredients” not “Amount of Ingredients.”
It’s too busy and it appears to follow the ADA nutritional guidelines which are absurd and the reason we have this obesity problem to begin with. I agree with Texason.
How would you improve the existing nutrition label?
—
It seems to me that we should switch over to metric or report things in English measurement, but not do this convoluted reporting of food in metric units and everything else, including recipes, in English. My vote is to teach everyone metric and switch over: it is so much easier and EVEN THE ENGLISH use metric for much of their measurements due to its ease.
The top rectangle needn’t be that large. A pie chart would also suffice nestled in with the other metrics. There’s a lot of whitespace in the bottom left corner… just throw it in there. What we’re getting at here is relative properties and amounts in the food. You can get that from a small pie chart just fine. De minimis items could be grouped together or broken out.
Calories: Fat, carbs, protein could all be aligned horizontally. Vitamins and the like could be underneath and in two columns. I think the icons are a waste of space. I don’t need to know what a measuring spoon looks like unless it is to scale.
Get rid of the judgement calls. That is really difficult and is way subjective depending on people’s diets. I’m not eating a low calorie diet, for example. But I would like to keep my proportions of calories balanced. I like the bar chart thing going on here, but it loses something without having a hollow box that equates to 100%. What happens when something is >100%?
Seems like interactive e-ink packaging will be a better solution to this problem.