Computers can calculate an infinite number of colors, but our brains can only process and see so much. This is why color spaces are important in visualization. Your code might dictate different shades, but they might look the same when you look at the visual.
And it’s why Scott Sievert explored the various spaces and provides an interactive for comparing various shades.
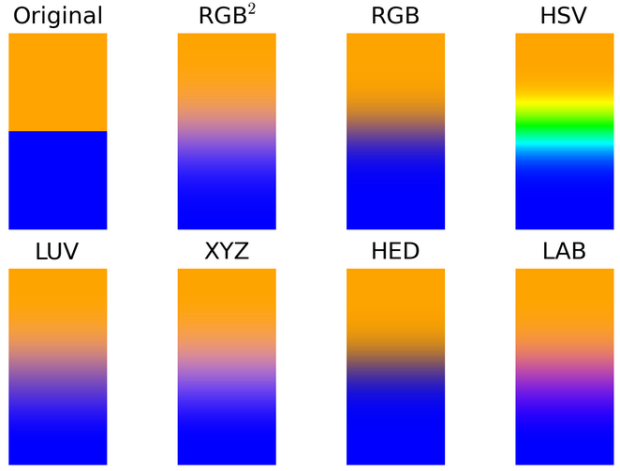
We see that certain color spaces are constrained by device limitations (RGB, HED). We see that other color spaces emphasize the pigments (HSV) or other elements like additive/subtractive color (LUV, LAB). We see that certain color spaces play nicely with addition and perform a smooth gradient between the two colors (XYZ, RGB
2 aka the method described above).

 Visualize This: The FlowingData Guide to Design, Visualization, and Statistics (2nd Edition)


