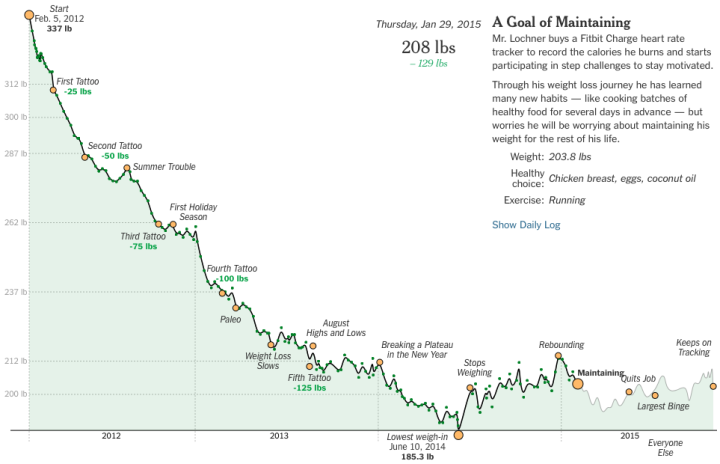
With the availability of weight and food tracking apps these days, there are thousands of people building out their time series every day. Albert Sun for the New York Times visualized the outlier case of Steve Lochner who lost over 100 pounds during a three-year period.
Once again, the annotation makes it. As you scroll, the timeline plays out and significant events such as spikes, drops, and milestones are marked and explained. Keep on scrolling and you see how Lochner, labeled as a “super tracker”, compares to others who set a 50-plus pound weight loss goal.


 Plotly, a service that lets you make interactive charts online,






 Visualize This: The FlowingData Guide to Design, Visualization, and Statistics (2nd Edition)


