Heartbeat during marriage proposal
Dec 12, 2014

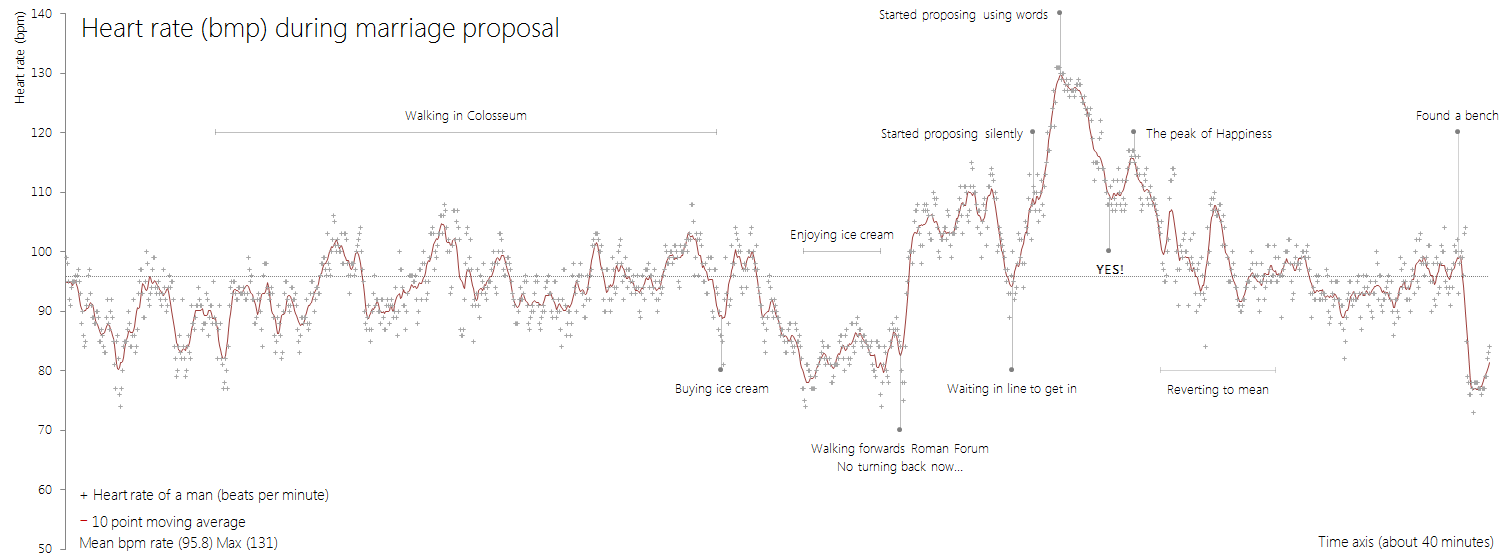
The moments leading up to a marriage proposal can be both exciting and nerve-racking. Will s/he say yes? What if I fumble up the words? Am I walking towards a disaster? Then it happens, everything blurs together, and the moment makes its way back to normal.

Reddit user sesipikai tracked his proposal during a trip to Italy. He happened to be wearing a heart rate belt, and you can see the rise and fall of beats per minute leading up to the question.

Walk. Ask. She says yes. Bask in the happiness. Find a bench.

Ah, the little bits of narrative totally make the chart.

Become a member. Support an independent site. Make great charts.

See What You Get
Learn to Visualize Data See All →

How to Make a Custom Stacked Area Chart in R

You could use a package, but then you couldn’t customize every single element, and where’s the fun in that?

How to Make Bivariate Area Charts in R

Quickly compare two time series variables with this line-area chart hybrid that originated in the 1700s. Also known as: difference chart.

Compact Ways to Visualize Distributions in R

For when you want to show or compare several distributions but don’t have a lot of space.

How to Make Unit Charts with Icon Images in R

Make the unit chart less abstract with icons that represent the data, or use this in place of a bar chart.

Favorites

Data, R, and a 3-D Printer

We almost always look at data through a screen. It’s quick and good for exploration. So is there value in making data physical? I played around with a 3-D printer to find out.

Best Data Visualization Projects of 2016

Here are my favorites for the year.

How You Will Die

So far we’ve seen when you will die and how other people tend to die. Now let’s put the two together to see how and when you will die, given your sex, race, and age.

What Qualifies as Middle-Income in Each State

The meaning of “middle-income” changes a lot depending on where you live and your household size.