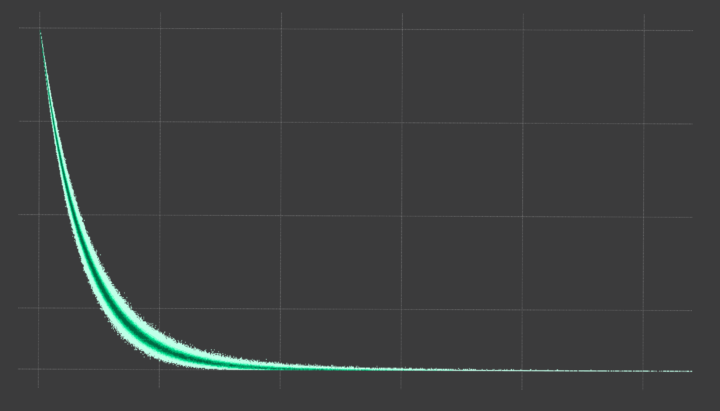
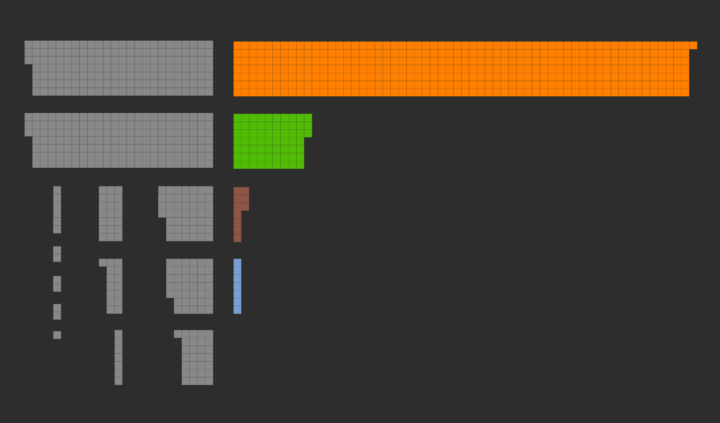
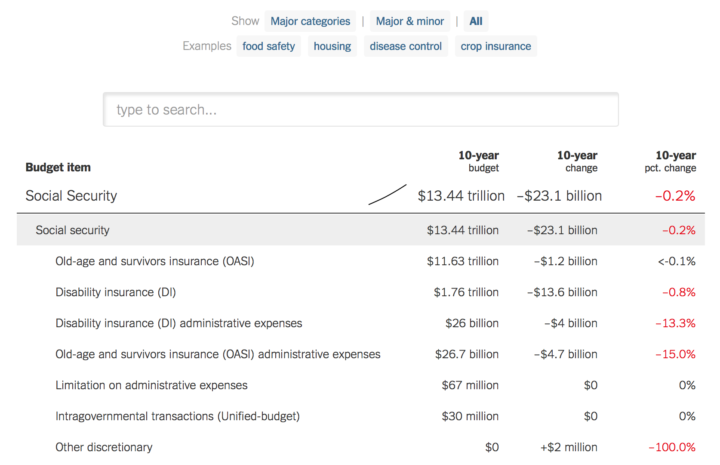
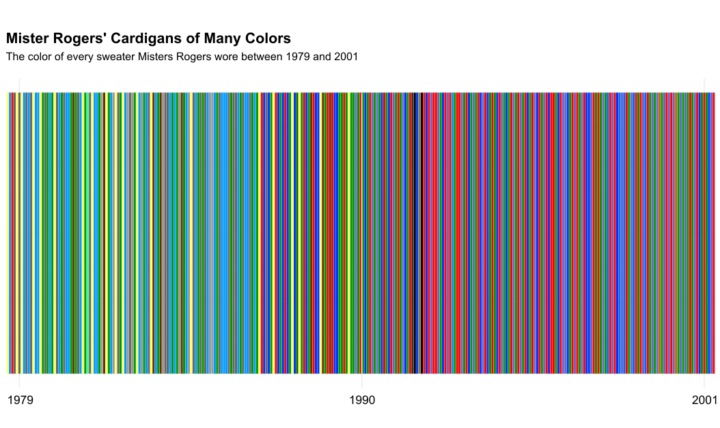
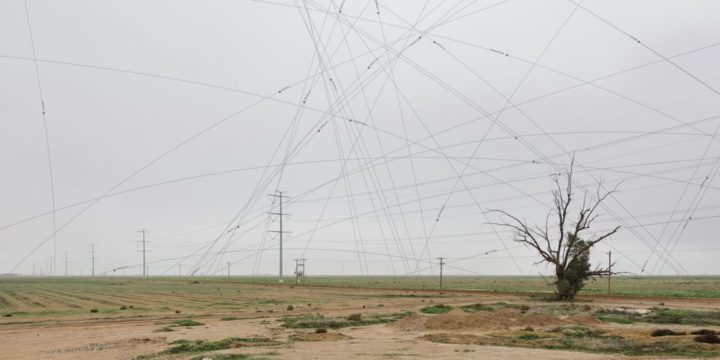
The WeMo Insight Switch from Belkin lets you remotely control a power outlet and tells you how much power the devices you plug into it use. More interested in the latter, I got one to see how well it works. Here are my first impressions with about a month of use and a week of data.
Read More
-
-
Before your next flight, road trip, or hike, download the Flyover Country app available for Android and iPhone. The app tells you information about where you are at any given moment, or if you’re flying, the ground beneath.
The app exposes interactive geologic maps from Macrostrat.org, fossil localities from Neotomadb.org and Paleobiodb.org, core sample localities from LacCore.org, Wikipedia articles, offline base maps, and the user’s current GPS determined location, altitude, speed, and heading. The app analyzes a given flight path and caches relevant map data and points of interest (POI), and displays these data during the flight, without in flight wifi.
-
Sedimentary geologist Zoltan Sylvester downloaded Landsat data using Earth Explorer and strung together images of the Ucayali River to see the changes over thirty years.
Thanks to the Landsat program and Google Earth Engine, it is possible now to explore how the surface of the Earth has been changing through the last thirty years or so. Besides the obvious issues of interest, like changes in vegetation, the spread of cities, and the melting of glaciers, it is also possible to look at how rivers change their courses through time.
Yeah, I’m gonna have to look at other areas of the world now. Brb.
-
We know when people usually get married. We know who never marries. Finally, it’s time to look at the other side: divorce and remarriage.
-
Data checking is a pain and can be what stands between you and a good analysis or visualization session. Data Proofer aims to take away some of the pain by automating some of the process.
Every day, more and more data is created. Journalists, analysts, and data visualizers turn that data into stories and insights.
But before you can make use of any data, you need to know if it’s reliable. Is it weird? Is it clean? Can I use it to write or make a viz?
This used to be a long manual process, using valuable time and introducing the possibility for human error. People can’t always spot every mistake every time, no matter how hard they try.
Data proofer is built to automate this process of checking a dataset for errors or potential mistakes.
Gonna have to take this out for a spin.
-
Robert Simmon provides a hands-on guide to get true color from satellite imagery. The atmosphere makes it a little tricky:
The atmosphere scatters light from the sun before it hits the ground (or a cloud, but we don’t care about those at the moment), and then scatters reflected light again on its way back to a sensor. The atmosphere even scatters light back into a camera that didn’t hit anything on the ground at all.
That would be challenging enough, but the atmosphere changes from one place to another (the air above deserts is typically dry, while the air above a forest is usually moist (even when not cloudy) and often filled with tiny aerosol droplets), and over time (a hazy summer day compared to a crisp fall evening).
-
A couple of years ago, Eric Odenheimer wondered: If you stand on the beach looking out to the ocean and traveled straight until you reach land, what country would you reach? He only used latitude though. However, in real life, coastline is jagged and points in all directions, so you don’t always face east and west. Cartographer Andy Woodruff took these directions into account and drew a more accurate picture.
Read More -
Robert O’Connell for the Atlantic ponders basketball analytics and the rise of Stephen Curry.
Like every sport, basketball has recently undergone a statistical overhaul. A new generation of analysts has pored over the game and come to conclusions about the efficacy of certain players and techniques. Their findings have met mixed acceptance from the old guard of coaches and executives, but at least one of their takeaways is now visible every night in the NBA. The three-point shot, for much of its history a novelty or minor part of teams’ strategies, has become an essential component of almost every team’s offensive attack. As recently as 2012, the average team took about 1,200 threes over the course of a season; last year, that number ballooned to over 1,800.
The difference between the Golden State Warriors and most other teams is that the shots go in, often in spectacular fashion. For this 2015-16 season, the Warriors put up more threes than anyone, but they made 41.5 percent of them so far, whereas everyone else is below 40.
-
I don’t read visualization books nearly as much as I wish I did, but there are a handful I keep on the shelf for a rainy day, which until recently was basically never here in California. I updated the books page to show some of my favorites.
I also added a few books in my queue that I hope to get to one day. Two are new visualization books that I heard good things about, one is an introduction to statistics (mostly for teaching reasons), and the last is a not-so-new one on design.
By the way, the statistics textbook is available for free as a PDF download.
-
“Weather data is this endless box of LEGO pieces that arise every day. It’s always a different box.” Sculptor Nathalie Miebach makes these ornate baskets based on weather data.
-
Peter Dodds teaches a course on complex networks, and he put together a set of tarot cards to illustrate concepts. Fun.
P.S. You can also watch the entire lecture series on YouTube.
-
-
-
Popular news topics change depending on where you are, as what’s important to some isn’t so important to others. Unfiltered.news from Google’s Jigsaw team shows what’s covered everywhere.
Every day, tens of thousands of publishers report the news world wide. Unfiltered News allows you to explore Google News data across all publishing languages and locations to find important global stories and perspectives that may not be covered in your location. Discover which locations report on similar topics, compare different perspectives on an issue, and track issue coverage over time.
-
Truth & Quantity by Gregor Hochmuth is what happens when you strip out all context from an NPR newscast and only look at the numbers.
Every day at 8am and 8pm, Truth & Quantity transcribes NPR’s hourly news update using speech recognition & natural language analysis. It then selects all plural nouns from the news script and generates two compilations: one for each month (going back to 2009) and another for various quantities, such as all instances of “7” or “100 million.”
Click on any number to get more of a sentence.
Good stuff. Find out more here.
-
Jellybooks is an analytics company that evaluates how people read book, in a similar fashion in how a company like Netflix evaluates how customers watch shows.
Read More -
Members Only
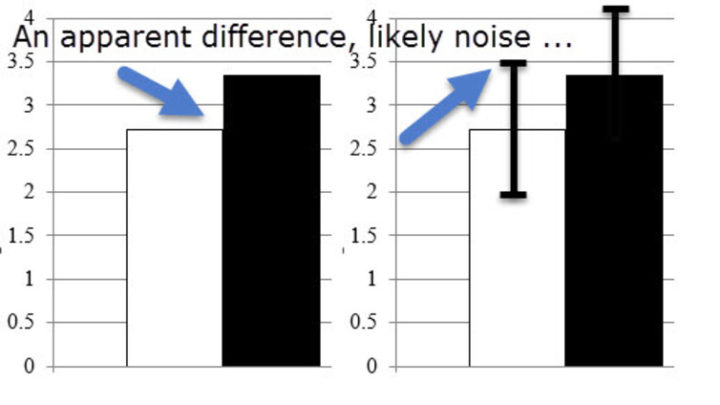
Make sure you explain your visual encodings so that others can interpret them.
-
National Geographic, in collaboration with Bestiario, looks at the improving accessibility to clean water around the world.
In 1990, as part of the Millennium Development Goals, the UN set a target to halve the proportion of people without access to safe drinking water. The world hit this goal in 2010, and as of 2015, some 90 percent of the world’s people now have access to “improved” water—water from sources such as pipes or wells that are protected from contamination, primarily fecal matter.
There’s still a lot of work to do though. In some places, such as Haiti and Mongolia, conditions worsened from a percentage perspective and about of third of the populations still don’t have access.
-
With election season in full swing, as far as the news is concerned at least, we get to see poll after poll in the beginning of a voting day and then reports the next day about which ones were wrong. Based on the news alone, it feels like almost every poll is just plain wrong. Maarten Lambrechts shows what’s going on here with Rock ‘n Poll. It simulates a poll and then multiple polls, showing how small differences in the numbers can seem like a lot once the voting results come in.