For Knowable Magazine, Betsy Mason looks at the state of (not so good) data visualization in science and offers some direction for how it can improve:
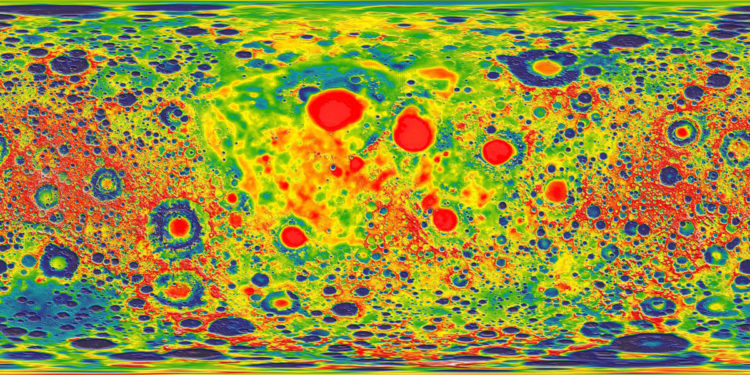
[S]cience is littered with poor data visualizations that confound readers and can even mislead the scientists who make them. Deficient data visuals can reduce the quality and impede the progress of scientific research. And with more and more scientific images making their way into the news and onto social media — illustrating everything from climate change to disease outbreaks — the potential is high for bad visuals to impair public understanding of science.

 Visualize This: The FlowingData Guide to Design, Visualization, and Statistics (2nd Edition)


