• Membership
  • Newsletter
  • Projects
  • Learning
  • About
  • Member Login
  • Datylon Graph is a visualization extension for Illustrator

    February 18, 2020

    Topic

    Software  /  Datylon, Illustrator

    Adobe Illustrator has charting functions that can be useful if you’re on a deadline. Make a quick chart, design, and publish. However, if you want to reuse the chart with new data or need to use a more complex chart type, it’s usually been better to use different software and then come back to Illustrator to adjust.

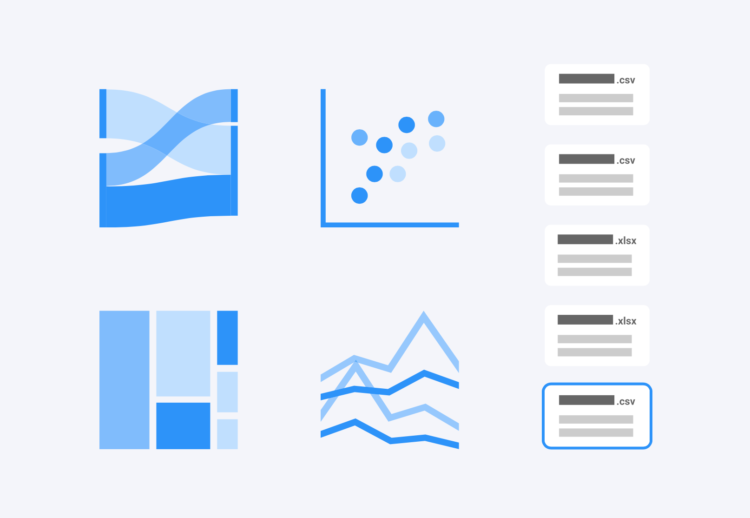
    Datylon Graph is an extension that aims to make it easier to stay in Illustrator for your full workflow. It promises reusable charts, collaborative tools, and a growing visualization library.

    It currently starts at €7.50 per month with a 14-day free trial. I’m skeptical about working completely in Illustrator, but I’ll have to kick the tires on this soon.

  • Most often missed areas while washing hands

    February 18, 2020

    Topic

    Infographics  /  handwash, hygiene

    This graphic from WakeMed shows the areas most often missed while washing hands. It’s based on an old-ish study from 1978 by Taylor LJ that evaluated handwashing techniques by health professionals. I’m guessing (hoping) that technique has improved since then.

    Also, if there were a diagram based on data collected from the men’s room, the hands would just be completely colored red. Wash your hands, please. It’s kind of important right now.

  • Botnet, a social network where it’s just you and a lot of bots

    February 14, 2020

    Topic

    Apps  /  artificial intelligence, bot, social media

    Botnet is a social media app where you’re the only human among a million bots trained on social media activity. Post pictures, status updates, or whatever else you want. Then let the likes and weird comments roll in.

    You can even purchase troll bots, bots that tell dad jokes, and more bots.

    Social media is on its way to mostly being bots anyways. Might as well jumpstart the future. Artificial intelligence for the win.

  • Members Only

    Big Money You Can Relate To (The Process #76)

    February 13, 2020

    Topic

    The Process  /  money, scale

    This week, a few projects went up on the internets about money and spending, each with different goals and approaches. In this issue of The Process, we look at each more closely.

  • Printing money at the speed of various wages

    February 13, 2020

    Topic

    Infographics  /  animation, money, Neal Agarwal

    Neal Agarwal used a money printing metaphor to depict differences in various wages. The higher the wage, the faster the money prints. Keep scrolling and you also see big company revenues, finished with a frantic U.S. deficit increase.

    So good. [Thanks, Neal]

  • Federal budget scaled to per person dollars

    February 12, 2020

    Topic

    Statistics  /  Alicia Parlapiano, budget, Quoctrung Bui, scale, Upshot

    For The Upshot, Alicia Parlapiano and Quoctrung Bui scaled down the federal budget to something more relatable:

    To better understand how federal spending has changed since Mr. Trump has taken office, we looked at the actual budget amounts for the 2020 fiscal year. We divided them by the U.S. population and sized the numbers proportionally to make their scale easier to visualize. Then we compared the numbers to the actual budget for the 2016 fiscal year, adjusting for inflation and population changes.

    Federal budget visualizations usually aim to show big dollar values going to many different departments. You look at the breakdowns, and you can’t help but think, “That’s a lot of money.” For most of us, it’s hard to imagine billions of dollars, because the scale is so far beyond our own experiences.

    So it’s interesting that this piece goes the other direction and scales everything down to match the values to something more familiar. The font size of each value also scales accordingly, which I think in the end is what you end up focusing on.

  • Blanket visualizes daily high and low temperatures

    February 12, 2020

    Topic

    Data Art  /  blanket, physical, temperature

    Reddit user quantum-kate used daily high and low temperatures in Denver in 1992 as the basis of this blanket. I feel like I should learn to knit crochet.

  • A tour of the king’s tattoos

    February 11, 2020

    Topic

    Infographics  /  3-d, DR, King Frederick, tattoos

    DR used a 3-D model to recreate King Frederick the 9th’s ink:

    King Frederick the 9th was famous for his tattoos. But until recently — noone knew much about them. By examining hundreds of old photographs and films we have recreated the Kings’ ink in order to get a sence of who he was — both on the inside and the outside.

    The scrolly touring works really well here. I went in knowing nothing about the king and came out more educated on the other side.

  • Billionaire’s spending scaled to your net worth

    February 10, 2020

    Topic

    Statistics  /  money, scale, Washington Post, wealth

    We hear about billionaires spending millions of dollars on ads, acquisitions, etc. It seems like a ridiculous amount of money, but that’s partially because us common folk think of the millions of dollars in the context of our own net worth. When Jeff Bezos spends a few multiples of what we will never make in a lifetime, it seems like a lot.

    For The Washington Post, Michelle Ye Hee Lee and Youjin Shin made an interactive that instead looks at the spending as a percentage of net worth. The purchases suddenly seem less crazy (sort of).

    It’s simple math but a nice way to make the spending scales more relatable.

  • Good state naming

    February 7, 2020

    Topic

    Maps  /  America, humor

    From @haru_cchii on the Twitter:

    Local German Gets Bored And Tries To Name All American States
    i think i did pretty well

    Seems right to me.

  • Data problems in Iowa caucus results

    February 7, 2020

    Topic

    Statistics  /  caucus, error, Iowa, Upshot

    It wasn’t just issues with an app. There appears to be many more problems with the Iowa caucus results. The Upshot broke it down with a closer look at the data:

    Some of these inconsistencies may prove to be innocuous, and they do not indicate an intentional effort to compromise or rig the result. There is no apparent bias in favor of the leaders Pete Buttigieg or Bernie Sanders, meaning the overall effect on the winner’s margin may be small.

    But not all of the errors are minor, and they raise questions about whether the public will ever get a completely precise account of the Iowa results. With Mr. Sanders closing to within 0.1 percentage points with 97 percent of 1,765 precincts reporting, the race could easily grow close enough for even the most minor errors to delay a final projection or raise doubts about a declared winner.

    When did voting get so complicated?

  • Privacy algorithm could lead to Census undercount of small towns

    February 7, 2020

    Topic

    Statistics  /  census, counting, New York Times, privacy

    To increase anonymity in the Census records, the bureau is testing an algorithm that removes real people and inserts imaginary people in various locations. As you can imagine, this carries a set of challenges. Gus Wezerek and David Van Riper for New York Times Opinion ask what effects this could have on small towns. [Thanks, Gus]

  • Members Only

    Misleading or Not? A Chart Showing Coronavirus Fatality Rate (The Process #75)

    February 6, 2020

    Topic

    The Process  /  coronavirus, misleading, New York Times

    Welcome to another episode of Misleading or Not? where we look at a chart and decide if it’s misleading or not.

  • Mapping the construction of railroads in America

    February 6, 2020

    Topic

    Maps  /  animation, Financial Times, railroad

    For the Financial Times, Alan Smith and Steven Bernard traced the history of railroad construction in America and mapped it over time. Literally. Bernard used digitized versions of old maps and traced each new segment by hand. Tedious, but the result is impressive.

  • CineShader, for cinematic shaders

    February 5, 2020

    Topic

    Software  /  Lusion, shader

    From Lusion, CineShader is a fun editor for those who are familiar with Shadertoy:

    CineShader is a real-time 3D shader visualiser. It leverages the Shadertoy.com API to bring thousands of existing shader artworks into a cinematic 3D environment.

    The whole project was started as an idea of using a web demo to explain what procedural noise is to our clients at Lusion. After sending out the demo to some of our friends, we were encouraged to add the live editor support and we decided to release it to the public.

  • Faking traffic on Google Maps with a wagon of 99 smartphones

    February 4, 2020

    Topic

    Data Art  /  Google Maps, physical, Simon Weckert, traffic

    Google Maps incorporates data from smartphones to estimate traffic in any given location. Artist Simon Weckert used this tidbit to throw the statistical models off the scent. With a wagon of 99 smartphones, he turned roads red on Google Maps just by walking around.

    Nice.

  • Layer Cake, a graphics framework for more flexible web graphics

    February 3, 2020

    Topic

    Coding  /  JavaScript, Layer Cake, Michael Keller, Svelte

    Michael Keller released a new version of Layer Cake:

    Layer Cake is a graphics framework built on top of Svelte. It measures your target div and your data and creates scales that stay synced on layout changes. Use these scales to organize multiple, mostly-reusable Svelte components, whether they be SVG, HTML, Canvas or WebGL. Since they all share the same coordinate space, you can build your graphic one layer at a time.

    I’m intrigued. (And I feel like I need to learn more about this Svelte.)

  • Presidential Hopefuls screensaver bounces heads around based on polling data

    January 31, 2020

    Topic

    Software  /  election, screensaver

    I know you don’t get enough election coverage these days and are probably like, “I wish there was a way I could be reminded of who’s running with bouncing heads across my screen whenever I come back to my computer. That would be super.” Well, look no more. The Presidential Hopefuls screensaver by Robert Tolar Haining is what you’re looking for.

  • Members Only

    Visualization Tools, Datasets, and Resources — January 2020 Roundup (The Process #74)

    January 30, 2020

    Topic

    The Process  /  roundup

    Every month I collect resources and tools to help you better visualize data. Here’s the good stuff for January 2020.

  • Flow Fields, a generative art tool

    January 30, 2020

    Topic

    Data Art  /  flow, Mike Freeman

    Flow Fields, a generative art tool by Michael Freeman, lets you adjust various parameters, such as color, smoothness, and fluctuations, and the flows just keep coming. Pretty.

    The code is up on GitHub and is based on Daniel Shiffman’s Coding Train tutorials.

  • Page 111 of 392
  • <
  • 1
  • ...
  • 108
  • 109
  • 110
  • 111
  • 112
  • 113
  • ...
  • 392
  • >

Analyze, visualize, and communicate data usefully, beyond the defaults.

Become a member →

Recently for Members

May 15, 2025
Step Chart, Enhanced

May 8, 2025
When the data is not what it seems

May 1, 2025
Finding the Right Charts

April 24, 2025
Visualization Tools, Datasets, and Resources – April 2025 Roundup

April 17, 2025
Breaking Out of Chart Software Defaults

Browse by Chart Type See All →

Heatmap Spiral Chart Table Calendar Horizon Graph Line Map Area Chart Venn Diagram Packed Bubble Chart Organogram

Browse By Topic

  • Visualization

    Seeing data

  • Maps

    Seeing geographic data

  • Infographics

    Explaining data

  • Networks

    Connecting data

  • Statistics

    Analyzing data

  • Software

    Working with data

  • Sources

    Getting data

  • Design

    Making data readable

Get the Book

Visualize This: The FlowingData Guide to Design, Visualization, and Statistics

Available now.

Order: Amazon / Bookshop

Made by FlowingData

  • The Process

  • Data Underload

  • Chart Everything

  • Guides

  • Books

  • Shop

  • About
  • Contact
  • Newsletter
  • LinkedIn
  • Instagram
  • Bluesky
  • RSS
Copyright © 2007-Present FlowingData. All rights reserved.