Areas represent total counts and the colors indicate categories. Together, the symbols show the distributions in a population.
Illustrator
-
Members Only
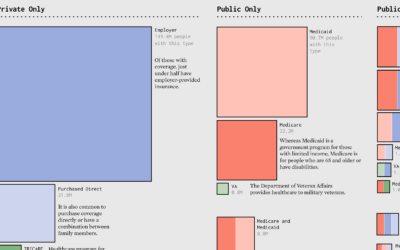
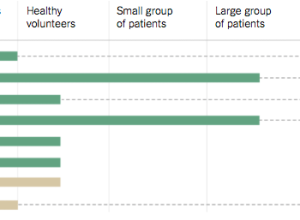
Make the Chart: Scaled Squares with Color Bands
-
Members Only
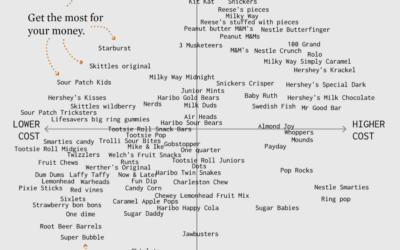
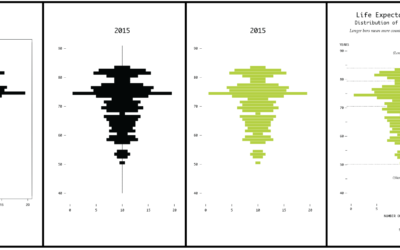
Make the Chart: Scatterplot Using Text Instead of Dots
I made a chart about Halloween candy. Even dumb charts need attention and require that choices are made.
-
Members Only
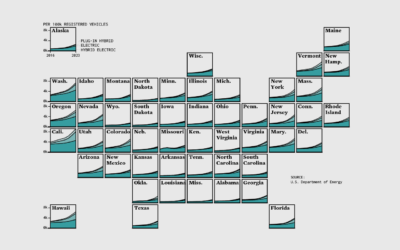
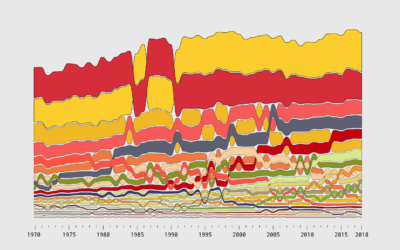
Make the Chart: Grid Map with Stacked Areas
Breaking it down to the small steps and choices with data, code, and editing that lead to a finished chart.
-
Members Only
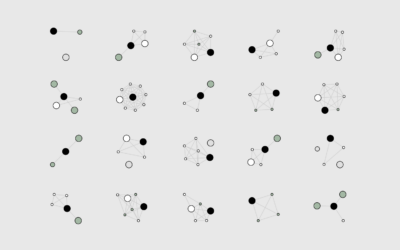
How I Made That: Network Diagrams of All the Household Types
Process the data into a usable format, which makes the visualization part more straightforward.
-
Members Only
How to Make Alluvial Diagrams
Here’s how to do it in R from start to finish, plus editing in illustration software. Make design choices and trade-offs for more readable charts.
-
Members Only
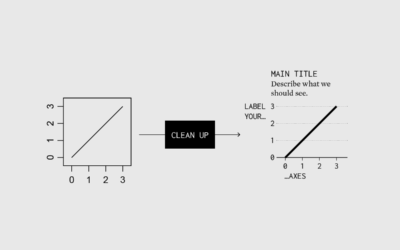
Process 123 – Cleaning Up Graphs in Illustration Software
I make most of my static charts in R, but I always bring them into Illustrator for polish, layout, and readability. Here’s my process.
-
Datylon Graph is a visualization extension for Illustrator
Adobe Illustrator has charting functions that can be useful if you’re on a…
-
Members Only
How to Edit R Charts in Adobe Illustrator
A detailed guide for R users who want to polish their charts in the popular graphic design app for readability and aesthetics.
-
Convert Adobe Illustrator files to HTML and CSS
For the folks who have to make graphics for all devices under the…
-
How to Make a Graph in Adobe Illustrator
You can use the vector-based software normally reserved for designers and artists to make and edit charts.
Recently for Members
Second Edition
 Visualize This: The FlowingData Guide to Design, Visualization, and Statistics (2nd Edition)
 Visualize This: The FlowingData Guide to Design, Visualization, and Statistics (2nd Edition)
New tools, refined process.
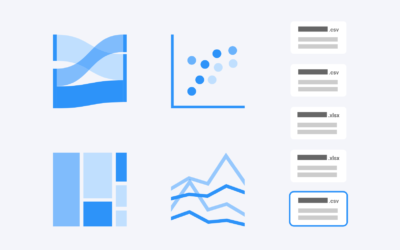
Browse by Chart Type See All →


