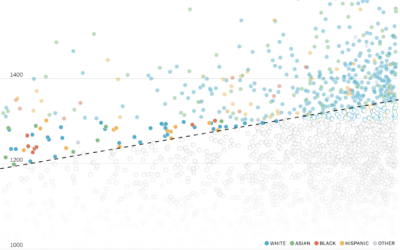
For NYT’s The Upshot, Aatish Bhatia and Emily Badger model how colleges might…
Statistical Visualization
Finding patterns, distributions, and anomalies.
-
Diversity in college admissions without considering race
-
Analysis of when movies use their own names in the dialogue
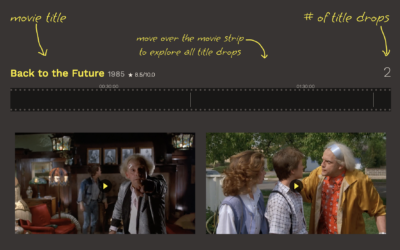
A title drop is when a movie mentions its own name during the…
-
Rise of Caitlin Clark, scoring machine
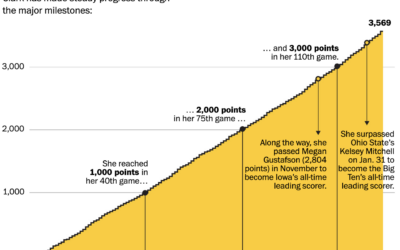
Caitlin Clark, a basketball guard for the University of Iowa, has been steadily…
-
Consumer confidence in current economic conditions
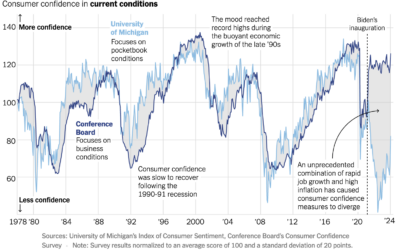
For NYT Opinion, Nate Silver compares consumer confidence between two surveys. The University…
-
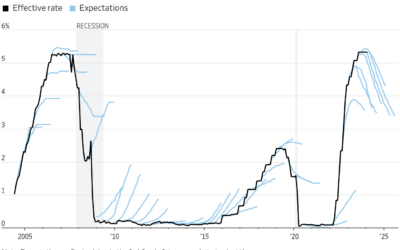
Investor expectations for interest rates compared to reality
This chart by Eric Wallerstein for the Wall Street Journal shows expectations against…
-
Researchers might have found Amelia Earhart’s crashed plane
For NPR, Juliana Kim reports:
Deep Sea Vision, an ocean exploration company based… -
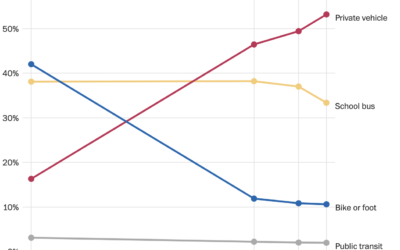
Decline of the school bus
For WP’s Department of Data, Andrew Van Dam notes the decline of the…
-
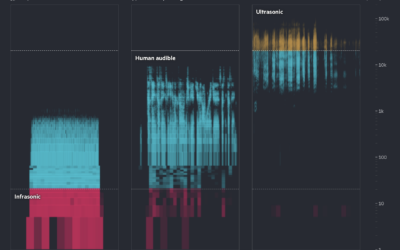
Learning animal languages with AI
Financial Times highlights how researchers are using AI to try to learn what…
-
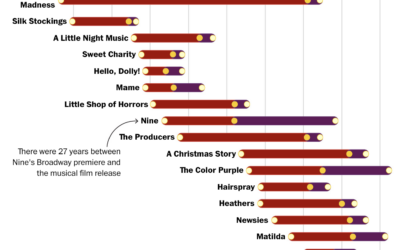
When movies become musicals and then movies again
For The Washington Post, Hanna Zakharenko charted all the movies that were adapted…
-
A hotter year, again
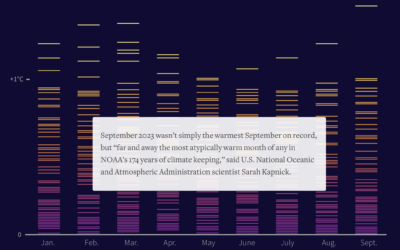
This year, 2023, was the hottest year on record. For Reuters, Gloria Dickie,…
-
Cost of assisted living where you are
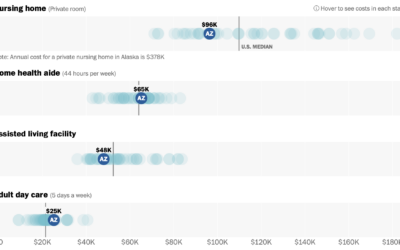
Assisted living can be expensive. For The Washington Post, Bonnie Berkowitz, Lauren Tierney,…
-
ER visits for Christmas decoration injuries
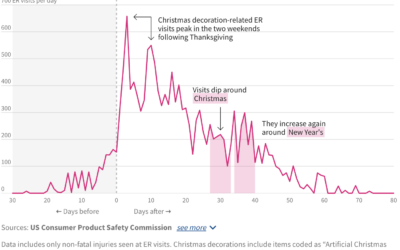
A lot of Christmas lights went up this past week. I hope you…
-
How much more income people need to be happy
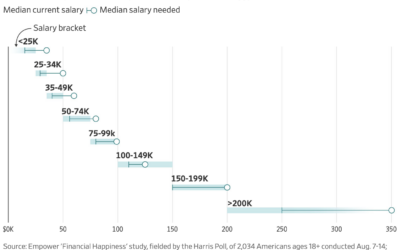
For the Wall Street Journal, Joe Pinsker reports on income and happiness, or…
-
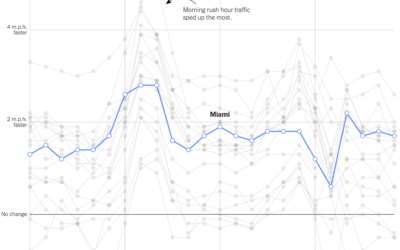
Change in commute times in major cities
Using GPS data processed by Replica, Lydia DePillis, Emma Goldberg, and Ella Koeze,…
-
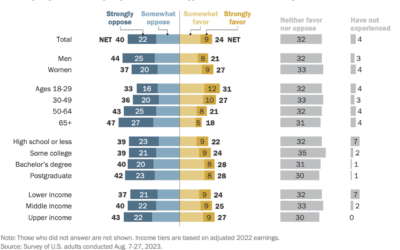
Attitudes towards tipping in the U.S.
Tipping seems to be in a confusing spot right now. On the one…
-
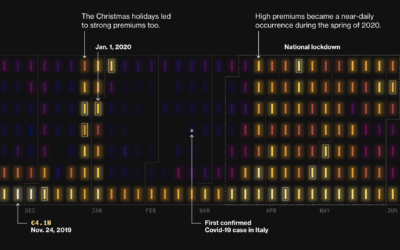
Premiums on electricity during Covid lockdowns in Italy
During Covid lockdowns, power companies in Italy charged premiums to cover increased prices…
-
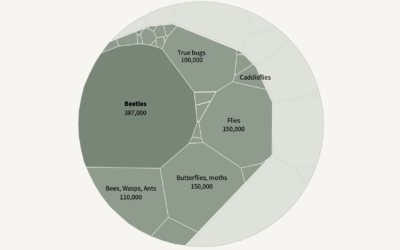
Falling insect species
Insects are dying at a high rate every year, but it is difficult…
-
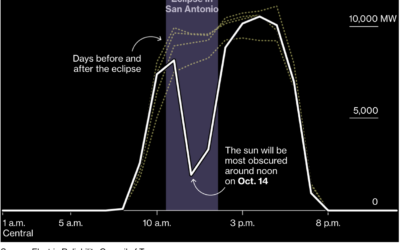
Dip in solar generation during the solar eclipse
Solar power is clean and all, but what happens when the sun is…


 Visualize This: The FlowingData Guide to Design, Visualization, and Statistics (2nd Edition)


