For Reuters, Arathy J Aluckal, Jitesh Chowdhury, and Vijdan Mohammad Kawoosa illustrate how…
Statistical Visualization
Finding patterns, distributions, and anomalies.
-
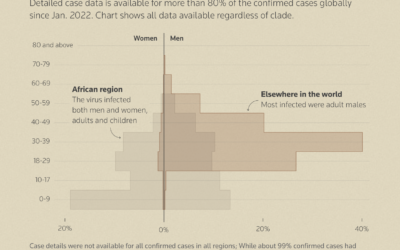
How mpox virus spreads
-
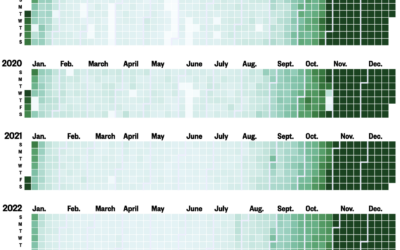
“All I Want for Christmas Is You” spreads to earlier months
For NBC News, Joe Murphy shows the play rate on Last.fm for Mariah…
-

Words that do not appear in literature
Word clouds show key terms or phrases that appear in a body of…
-
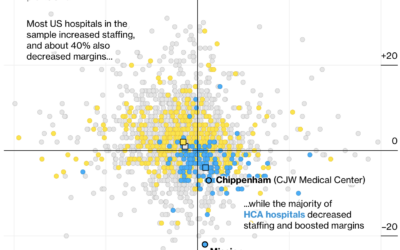
Higher margins with fewer hospital staff, not the best mix
Many hospitals in the United States are for-profit, which itself is not a…
-
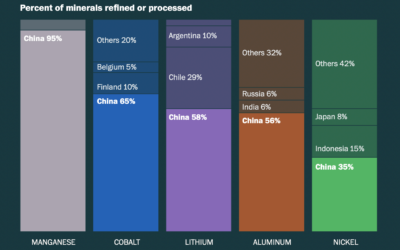
Material requirements from EV batteries
To make batteries for electric vehicles, manufacturers require materials from all over the…
-
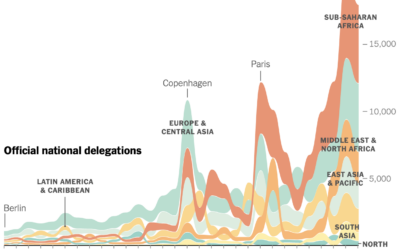
Participation in the annual United Nations climate conference
For the New York Times, Mira Rojanasakul visualized annual participation in the United…
-
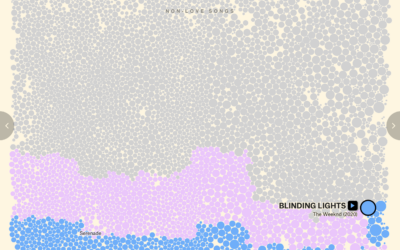
Evolution of the love song
For The Pudding, David Mora and Michelle Jia examine the death of the…
-
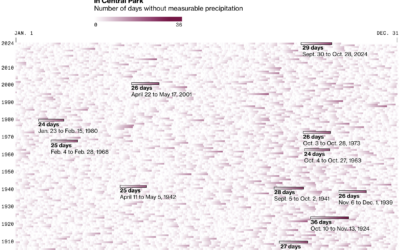
Days without rain
New York City recently issued a drought warning because of an abnormally dry…
-
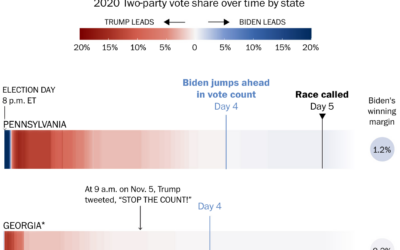
Why states swing while counts come in
Some might wonder why early results lean towards a party and then shift…
-
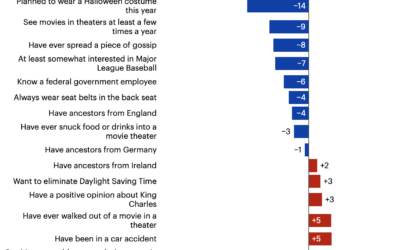
Presidential candidate preferences, by offbeat demographics
You’ve seen the voting tendencies among standard demographic groups, but there is so…
-
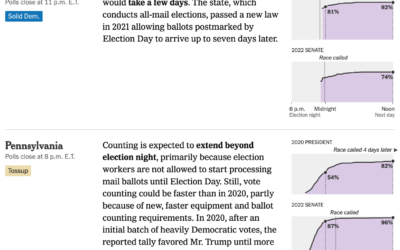
When to expect results from each state, based on previous elections
Some states count quickly, whereas others can take days. For NYT, Alicia Parlapiano…
-
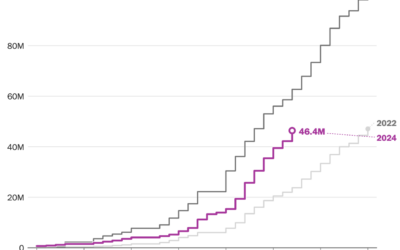
Early voting turnout
Early voting isn’t coming in as hot as in 2020, but there are…
-
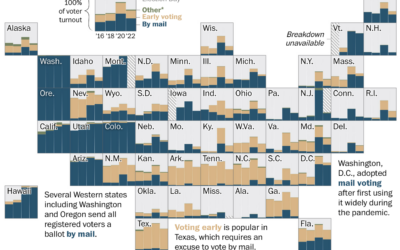
How Americans vote in each state
Some states have almost completely moved to voting by mail or early voting,…
-
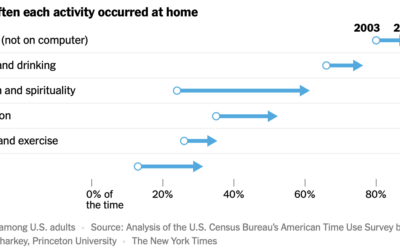
Increasing time spent at home
For NYT’s the Upshot, Ronda Kaysen and Alicia Parlapiano highlight analysis by Patrick…
-
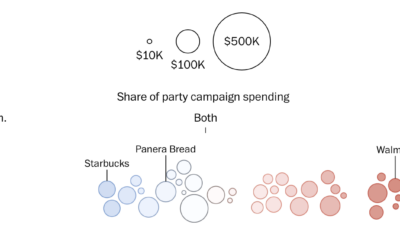
Restaurant preferences via campaign spending
For WP’s Department of Data, Kati Perry and Adrián Blanco examine campaign spending…
-
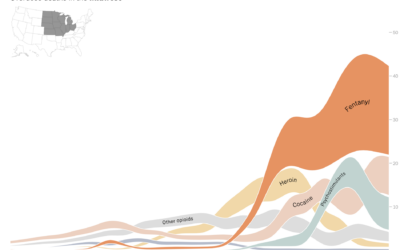
Rise in drug overdose deaths, led by fentanyl
Deaths by drug overdose in the United States increased sharply over the past…
-
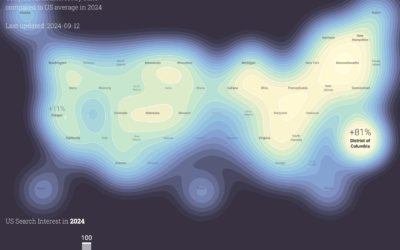
Political search interest in 2024
In a follow-up to the 2020 project, Moritz Stefaner and Google Trends show…
-
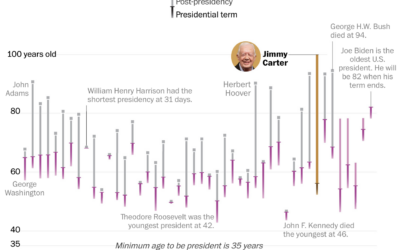
Jimmy Carter’s longevity compared to other U.S. presidents
Jimmy Carter, the 39th president of the United States, turned 100 years old.…
Recently for Members
Second Edition
 Visualize This: The FlowingData Guide to Design, Visualization, and Statistics (2nd Edition)
 Visualize This: The FlowingData Guide to Design, Visualization, and Statistics (2nd Edition)
New tools, refined process.
Browse by Chart Type See All →


