While the US has its own problems with debt somewhere in the range…
Network Visualization
Fun with links, nodes, and edges.
-
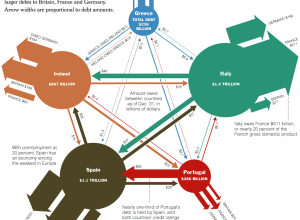
Europe’s web of debt
-
Elastic Lists code open-sourced
Moritz Stefaner, whose work we’ve seen a few times here on FD, just…
-
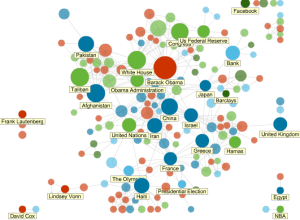
Most influential people on Twitter – Cosmic 140
Information Architects just released their annual Web Trends Map, but it’s not about…
-
Conversational Twitter threads visualized
Add another piece to the ever-growing list of Twitter visualizations. What makes Moritz…
-
Mapping GitHub – a network of collaborative coders
GitHub is a large community where coders can collaborate on software development projects.…
-
News Topics as Social Network
All news is connected in some way or another. News Dots from Slate…
-
Track Mouse Activity On Your Computer
Anatoly Zenkov provides this nifty tool (Mac and PC) to track your mouse…
-
The Most Efficient Way to Type
Are you using the most efficient typing technique or are your fingers jumping…
-
Canvi & Temps: An Exploration of Science Over Time
Bestiario, the group behind 6pli and a number of other network projects, released…
-
Twitter Mentionmap and Correlations at your.flowingdata
your.flowingdata got a couple of cool updates recently. One is based on your…
-
A New Way to Search Images With Google Image Swirl
There’s this branch in computer science and statistics for vision research. Normally, if…
-
The World of Seinfeld
After yesterday’s weirdness, I’m in the mood for something light.
The show about… -
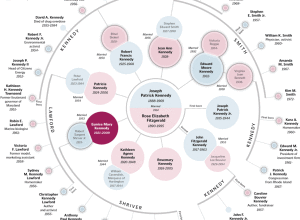
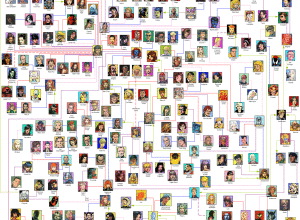
Detailed View of the Kennedy Family Tree
As far back as I can remember there’s always been a mystique around…
-
X-Men Universe Relationship Map
Contrary to what a lot people might think they know from the movies,…
-
Visual Representation of Tabular Information – How to Fix the Uncommunicative Table
This is a guest post by Martin Krzywinski who develops Circos, a GPL-licensed…
-
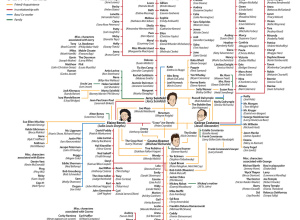
Campaign Contributions to the 110th Congress
This network graph shows common contributions between representatives in Congress:
A relationship exists… -
Phrase Net Shows the Secret Life of Words
Many Eyes, the social data analysis site, released another visualization tool – Phrase…
-
Ranking and Mapping Scientific Knowledge – eigenfactor
The Eigenfactor Project and Moritz Stefaner collaborate in these interactive visualizations “based on…
Recently for Members
Second Edition
 Visualize This: The FlowingData Guide to Design, Visualization, and Statistics (2nd Edition)
 Visualize This: The FlowingData Guide to Design, Visualization, and Statistics (2nd Edition)
New tools, refined process.
Browse by Chart Type See All →


