Check out this five-foot long LEGO world map.
[W]e wanted to have a…
Maps
Intuitive to look at spatial patterns and great for distributing geographic data.
-
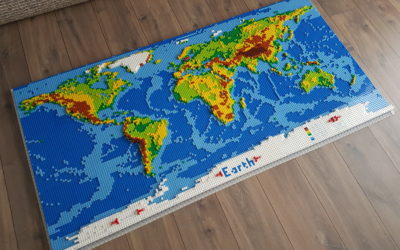
LEGO world map
-
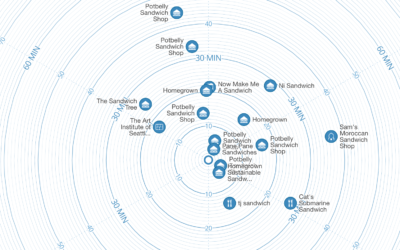
Time map shows locations based on how long it takes to get there
With the premise that we often search for locations based on how long…
-
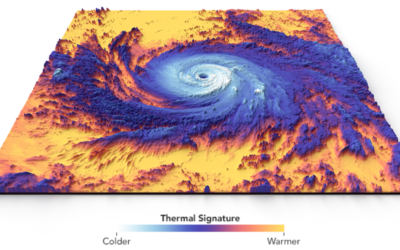
Thermal structure of Hurricane Maria
Hurricane Maria touched down in Puerto Rico. This visualization by Joshua Stevens at…
-
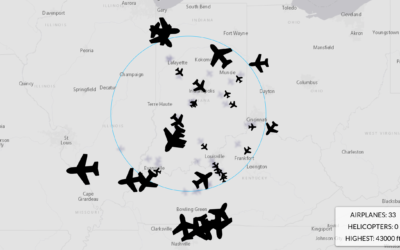
Aviation tracker with depth
I’ve grown bored of maps that show commuter traffic, but for whatever reason,…
-
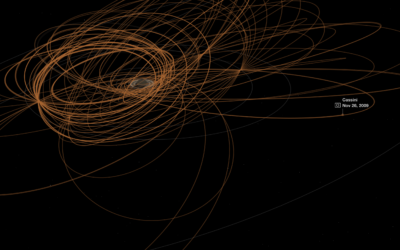
Tour of Saturn through Cassini, the satellite that crashes on Friday
About two decades ago, the Cassini satellite headed towards Saturn and has been…
-
Landsat satellite imagery browser
Downloading and viewing satellite imagery is a bit of a process. There are…
-
Mortgages in terms of years of working life
Buying a house is often confusing and complex, compounded by a dollar sign…
-
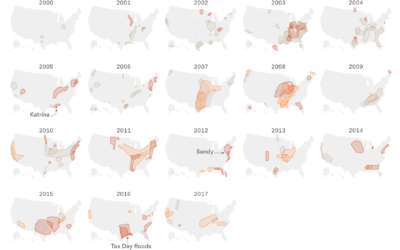
Thirty years of floods
Based on data from the Dartmouth Flood Observatory, Lazaro Gamio for Axios mapped…
-
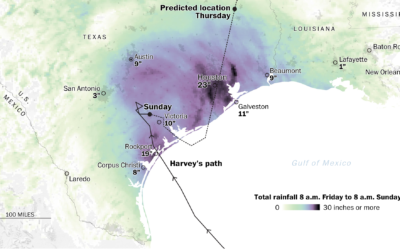
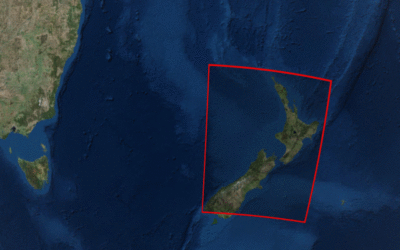
Harvey rainfall map
In case you didn’t hear, Houston is getting some rain due to Hurricane…
-
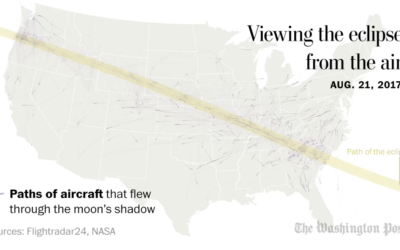
Flights passing through the shadow of the sun
Here’s a neat one by John Muyskens for The Washington Post. Using data…
-
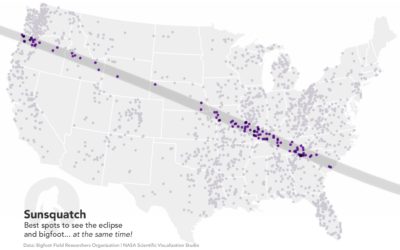
Sunsquatch, the only eclipse map you need
It’s solar eclipse time. There have been a lot of maps leading up…
-
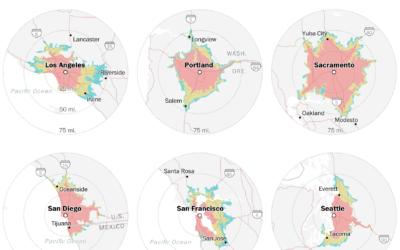
How far you can drive out of the city in one hour
Using anonymized cell phone data from Here Technologies, Sahil Chinoy for The Washington…
-
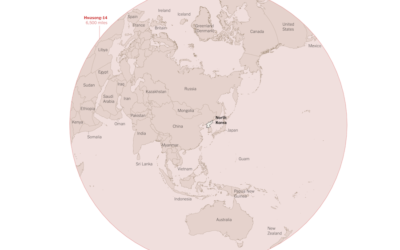
Where North Korea can reach with its missiles
Troy Griggs and Karen Yourish for The New York Times mapped the estimated…
-
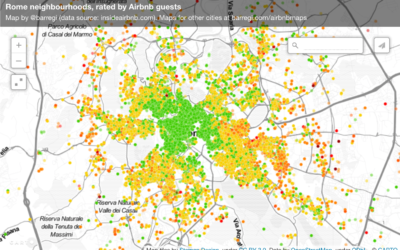
Perception of neighborhoods through Airbnb ratings
Beñat Arregi made a series of Airbnb maps with a simple premise. If…
-
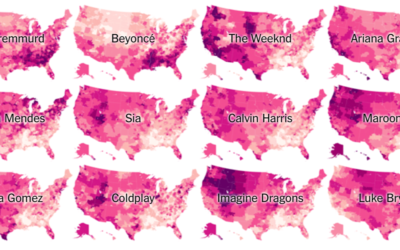
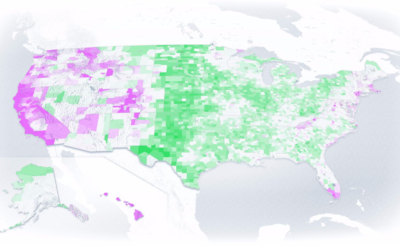
Music preference geography
Travel to different parts of the country, and you hear different types of…
-
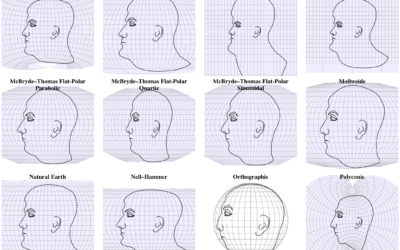
Interactive shows map projections with a face
We’ve seen faces as map projections before, but this is 63 projections on…
-
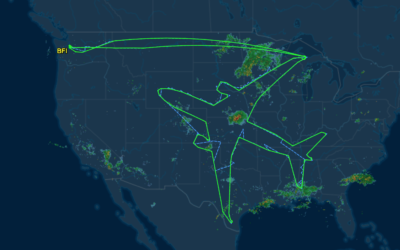
Boeing draws a plane in the sky with flight path
In a test flight, Boeing took the thing where you draw using your…
-
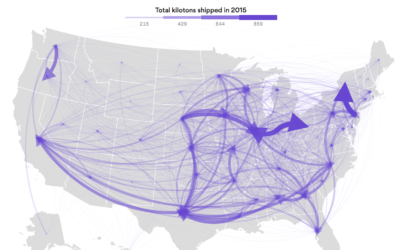
Flow of goods between states
Using data from the Freight Analysis Framework, Chris Canipe for Axios mapped the…
Recently for Members
Second Edition
 Visualize This: The FlowingData Guide to Design, Visualization, and Statistics (2nd Edition)
 Visualize This: The FlowingData Guide to Design, Visualization, and Statistics (2nd Edition)
New tools, refined process.
Browse by Chart Type See All →


