I feel like the large-volume coverage of the upcoming eclipse doesn’t quite match…
Maps
Intuitive to look at spatial patterns and great for distributing geographic data.
-
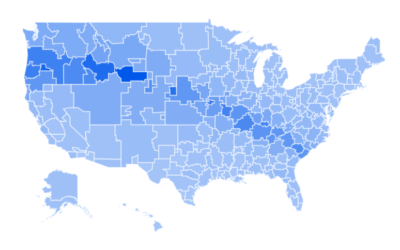
Google Trends eclipse interest
-
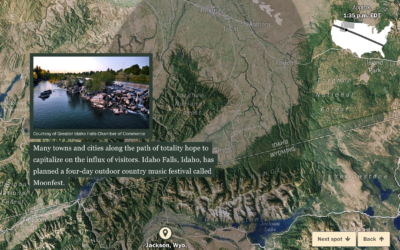
Satellite view of the upcoming eclipse’s path
In case you didn’t hear, a solar eclipse is on the way that…
-
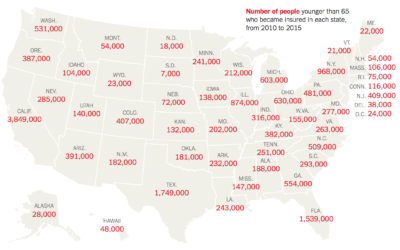
How many people might lose health insurance
The Urban Institute estimated how many people in each state gained health insurance…
-
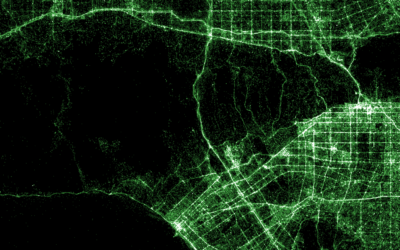
Shazam music recognition maps
Shazam is a service with an app that lets you point your phone…
-
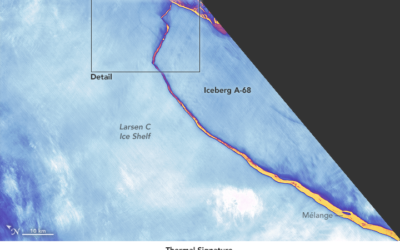
Detailed satellite view of iceberg break
Using the thermal signature, NASA provides a detailed view of the break:
The… -
Every solar eclipse in your lifetime
The continental United States gets a total solar eclipse on August 21, so…
-
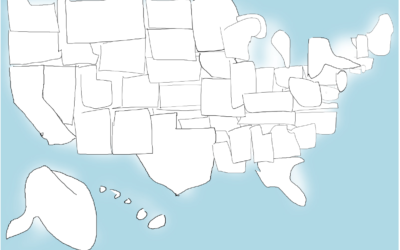
Test how well you can draw the states
Chris Wilson for Time has a fun piece up that tests how well…
-
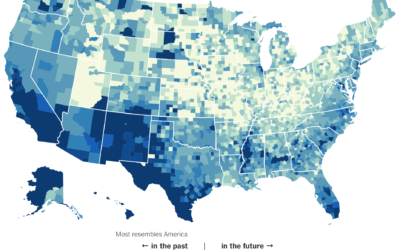
Parts of America that most resemble the future
The Census Bureau released estimates for demographic breakdowns for each county — in…
-
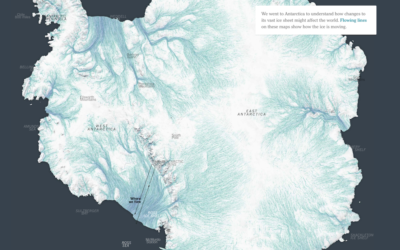
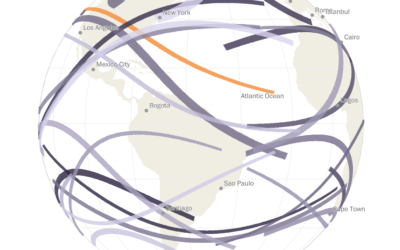
Moving ice
Ice in Antartica is in constant (very slow) motion, and as ocean waters…
-
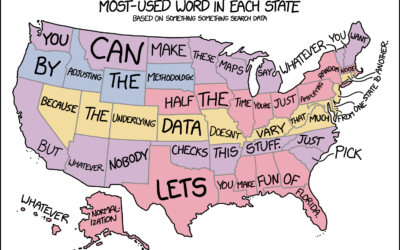
xkcd: Words in every state map
xkcd reading my mind somehow as usual. Not all state word maps are…
-
Comparing Google Maps and Apple Maps Over a Year
Google collects much of their own data to construct their maps, whereas Apple…
-
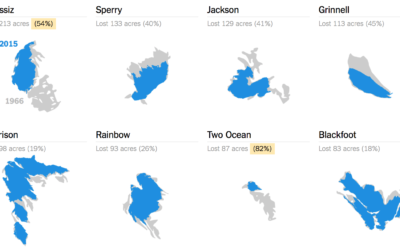
Melting glaciers
Glaciers at Glacier National Park in Montana are melting. Using data from the…
-
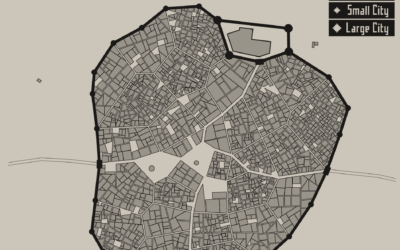
Medieval fantasy city generator
Game developer Oleg Dolya made a medieval fantasy city generator. Select the size…
-
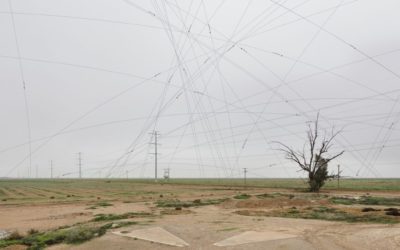
Satellites from the ground
There is a 16-by-16 mile grid of big X’s in the Sonoran Desert…
-
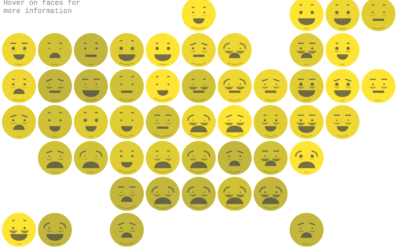
Chernoff emoji
Lazaro Gamio for Axios used Chernoff Faces that look like emojis.
This visualization… -
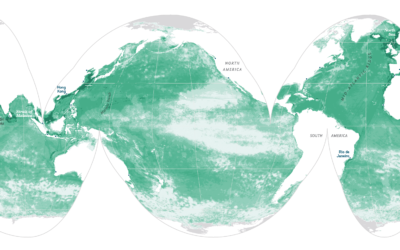
Breathing Earth of vegetation
Using data from NOAA STAR, Nadieh Bremer creates a breathing Earth that shows…
-
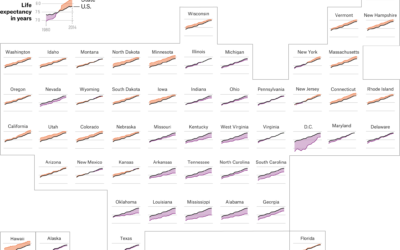
Life expectancy by state, against the US average
FiveThirtyEight continues their look at mortality by geography. This graphic by Anna Maria…
-
X-Ray of the oceans
Using satellite data and spatial models, researchers estimate human influence in the ocean.…
Recently for Members
Second Edition
 Visualize This: The FlowingData Guide to Design, Visualization, and Statistics (2nd Edition)
 Visualize This: The FlowingData Guide to Design, Visualization, and Statistics (2nd Edition)
New tools, refined process.
Browse by Chart Type See All →


