Facebook released Prophet, which is a procedure to quickly forecast with time series…
Software
Programs and online applications to help you make use of data.
-
Prophet for forecasting with a lot of data
-
Link
How to implement scrollytelling with six different libraries →
A brief look at six libraries to make your charts move as you scroll.
-
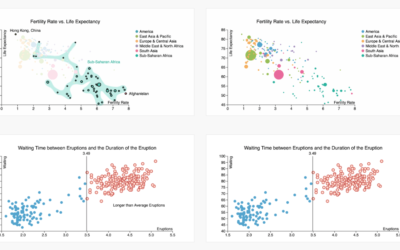
Annotate charts with a few clicks using ChartAccent
Some say annotation is the most important layer for charts meant for public…
-
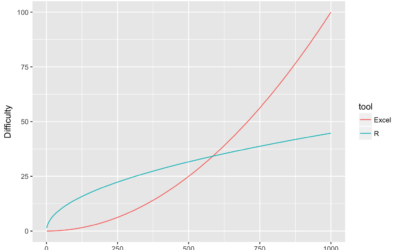
R for Excel users
For Excel users getting started with R, pain oftentimes finds its way into…
-
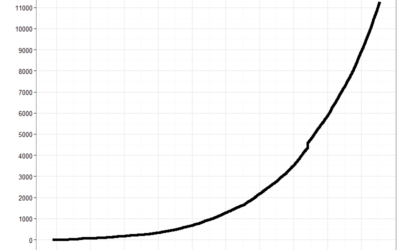
Now over 10,000 packages in R
There are a lot of R packages, which is why before I implement…
-
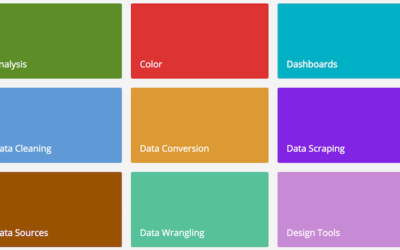
Catalog of visualization tools
There are a lot of visualization-related tools out there. Here’s a simple categorized…
-
Embedding.js: Data-driven environments for virtual reality
Embedding.js is a work-in-progress JavaScript library by Beau Cronin that makes it more…
-
Interpolate your data for animation in R
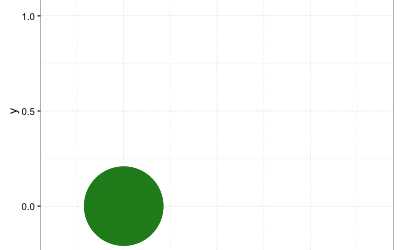
The tweenr package in R, by Thomas Lin Pedersen, helps you interpolate data…
-
Floaty bubble charts with d3.js
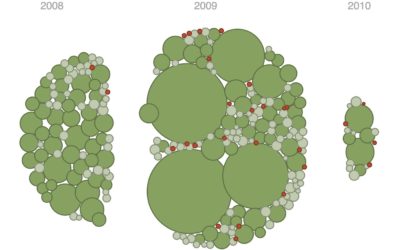
D3.js, or Data-Driven Documents, version 4.0 was released a few months ago, so…
-
Generate color palettes automatically
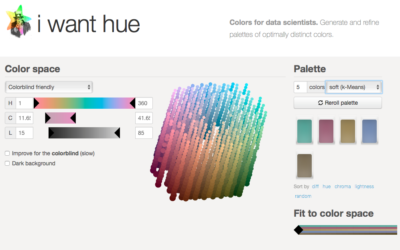
Default color schemes are often horrible, but spending a lot of time putting…
-
Textured SVG patterns in JavaScript
In case you didn’t get the memo, pattern fills are back and so…
-
Adjusting map data with Mapshaper
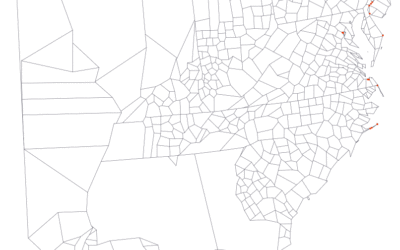
Map making is a finicky challenge where oftentimes your map data — points,…
-
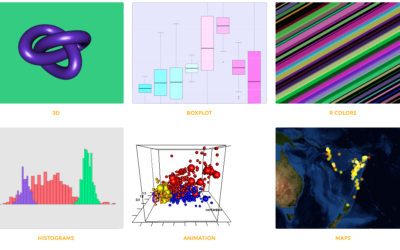
R graph gallery
One of best ways to learn visualization in any given software is to…
-
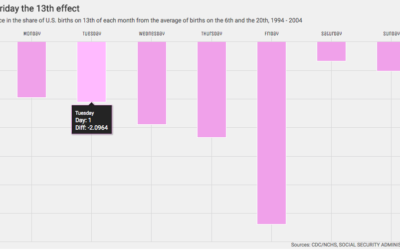
Interactive charts in R
Interactive charts in R are still so-so, but if you don’t mind giving…
-
Tilegrams in R
Last month Pitch Interactive launched an online tool for tiled cartograms, or tilegrams…
-
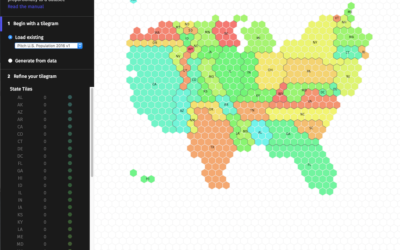
Make your own tiled cartograms
A challenge of using geographic maps to show data is that larger regions…
-
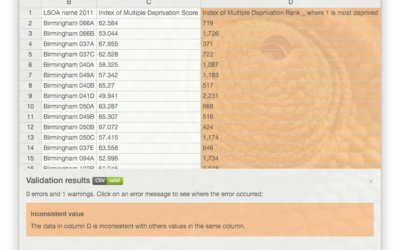
Comma Chameleon, a stripped-down CSV editor
CSV files are great, but every now and then you have to edit…
-
D3 in Depth
D3 is the most commonly used JavaScript library for visualization on the web,…
-
Colorgorical generates color schemes for you
Sometimes you need a color scheme quick, and ColorBrewer is typically the de…
-
Practical tips for scraping data
It’s an unpleasant feeling when you have an idea for a project and…




 Visualize This: The FlowingData Guide to Design, Visualization, and Statistics (2nd Edition)


