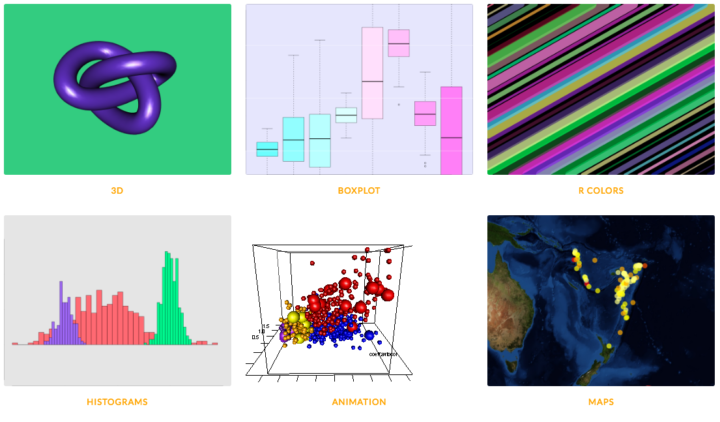
One of best ways to learn visualization in any given software is to look at examples and apply to your own data. The R graph gallery helps you with the first part providing plenty of examples and the code snippets to make them. It’s still relatively new, but it should prove useful as it grows (hopefully). [via Revolutions]
R graph gallery
Second Edition
 Visualize This: The FlowingData Guide to Design, Visualization, and Statistics (2nd Edition)
 Visualize This: The FlowingData Guide to Design, Visualization, and Statistics (2nd Edition)
New tools, refined process.