Where do street names come from? Sometimes there’s actual history behind a name,…
Maps
Intuitive to look at spatial patterns and great for distributing geographic data.
-
History of San Francisco street names mapped
-
Link
On Maps with Michal Migurski
Michal Migurski talks online mapping on the Data Stories podcast. Some history and current technologies. Skip to about 15 minutes in to get to the meat.
-
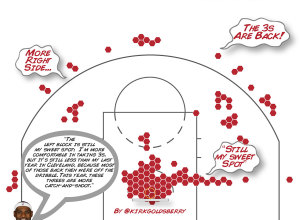
Shot charts show evolution of Lebron James
With the start of the NBA playoffs tomorrow, it’s worth coming back to…
-
Link
Crosslet
Crosslet is “a free small (22k without dependencies) JavaScript widget for interactive visualisation and analysis of geostatistical datasets.” It’s a combination of Crossfilter, Leaflet, and D3.
-
Visualizing the Paris metro system
Data visualization group Dataveyes looks closer at the Paris metro system from a…
-
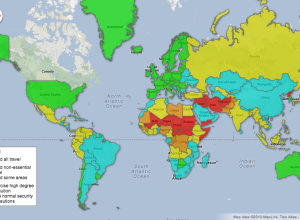
Map: Travel safety by country
As summer rolls around here on this side of the planet, CBC News…
-
Link
The fallacy of new cartography
Cartographer Kenneth Field argues that mapping on the Web isn’t really new. The technology is new, but the underlying cartography needs to remain as foundation for the area to move forward.
-
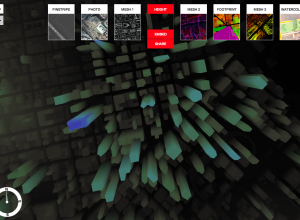
An experimental map service using 3-D data
For the past few months, Stamen Design has been working with 3-D data…
-
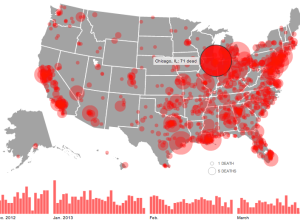
Gun deaths since Sandy Hook
The shooting at Sandy Hook Elementary School was horrible, but there have been…
-
March Madness fan map
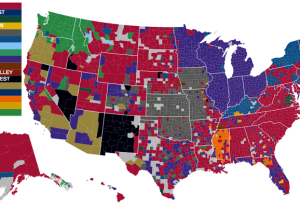
Along the same lines as their NFL fan maps, Facebook had a closer…
-
Link
Spatial Memory: Mapping Blank Spots in the Cheeseboard Maze
Mapping Blank Spots in the Cheeseboard Maze. “IST Austria Professor Jozsef Csicsvari together with collaborators has succeeded in uncovering processes in which the formation of spatial memory is manifested in a map representation.”
-
A new brand of cartographer
Emily Underwood on new cartographers and the growing field:
Geographers have traditionally studied… -
Link
Geo Point Plotter
Geo Point Plotter by Derek Watkins is a quick and dirty mapper. Copy and paste latitude and longitude coordinates, and you get a simple map with dots on it.
-
App shows what the Internet looks like
In a collaboration between PEER 1 Hosting, Steamclock Software, and Jeff Johnston, the…
-
Link
A Globe Hack and Good Old Mercator
A Globe Hack and Good Old Mercator. An illustration of the Mercator map projection using pennies. There’s some distortion.
-
Average commute times mapped →
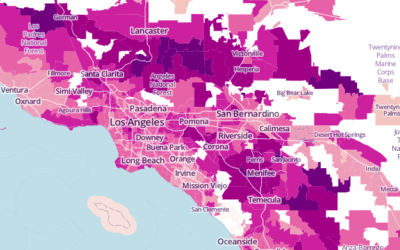
The United States Census Bureau just released county-level commute estimates for 2011, based…
-
Link
Teaching 2nd Graders About Maps
Cartographer Gretchen Peterson taught 70 second graders about maps. She talks about her positive experience and the kids’ excitement and makes the OSM index cards she used in the class.
-
SimCity 2013 is coming tomorrow
I’m not into video games, and my experience has been near zero since…




 Visualize This: The FlowingData Guide to Design, Visualization, and Statistics (2nd Edition)


