As schools begin to reopen, The New York Times illustrates why classrooms should…
Nathan Yau
-

Schools should open their windows for ventilation
-

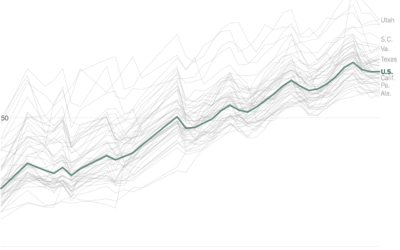
How Much Minimum Wage Changed in Each State
Minimum wage has increased over the years, but by how much depends on where you live.
-
Definition of an algorithm
Oftentimes we see “algorithms” referenced in various contexts, but the definition of an…
-
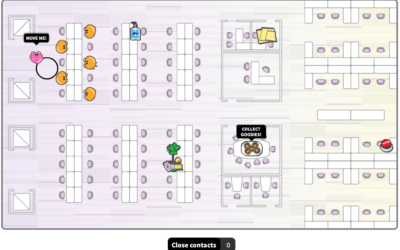
Social distancing when we’re back in the office
For Reuters, Sarah Slobin and Feilding Cage imagine life back at the office…
-
About that one-year decline in life expectancy
The Centers for Disease Control and Prevention released a report that said life…
-
Members Only
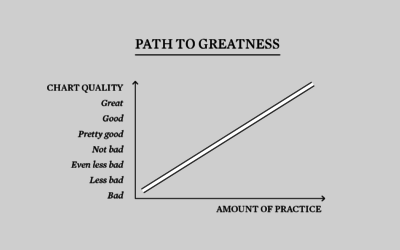
Make Bad Charts – The Process 128
Everyone’s a beginner at some point.
-
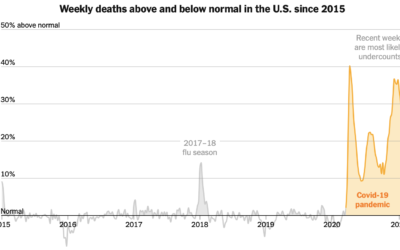
Scale of the pandemic compared to the past
While we’re on the topic of scale, The New York Times plotted weekly…
-
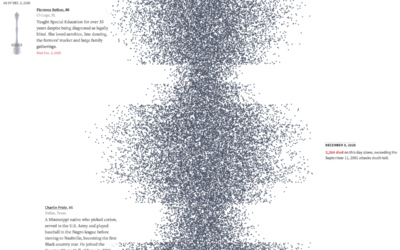
500,000 lives lost, an individual scale
The United States passed the half million mark for confirmed Covid-19 deaths. It’s…
-
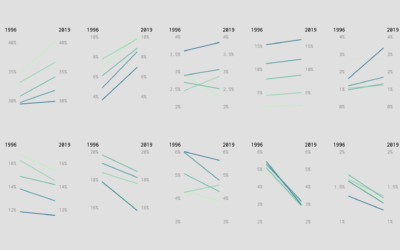
How Spending Changed for Different Income Groups
I compared spending in 1996 against the most recent spending estimates from the Bureau of Labor Statistics.
-
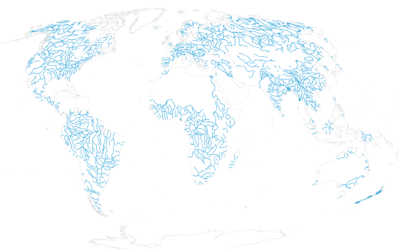
Introducing a New Course on Mapping Geographic Data in R, with ggplot2
I’m happy to announce a new course on mapping geographic data in R,…
-
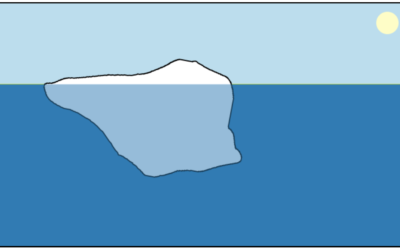
How that iceberg would really float
A common depiction of an iceberg is one that has a short head…
-
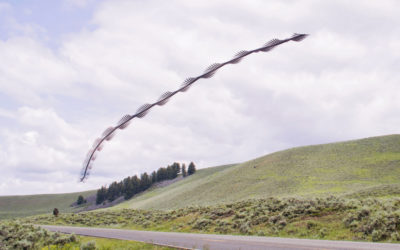
Bird flight patterns captured through long-exposure photography
For several years, Xavi Bou has been using long-exposure photography to capture stills…
-
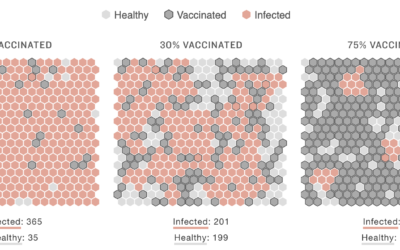
Simulation for different immunity scenarios
As vaccinations roll out, we work towards herd immunity, there are various challenges…
-
Members Only

More Colors vs. Fewer Colors – The Process 127
The two approaches answer two different questions.
-

Sim Daltonism, an intuitive app that simulates color blindness
When we visualize data to communicate to others, we must consider what others…
-
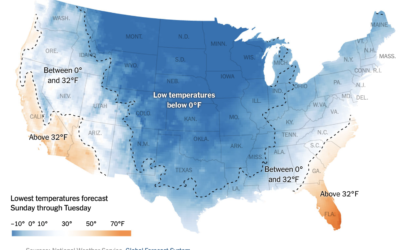
Low temperatures map of the United States
Based on data from the Global Forecast System, The New York Times mapped…
-
R graphics get modern text support, with ragg package
Thomas Lin Pedersen announced the ragg package, which makes font usage in R…
-
Improving vaccine distribution in all states
Lauren Leatherby and Amy Schoenfeld Walker reporting for The New York Times:
“Every… -
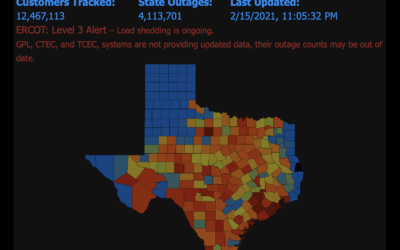
Map of power outages
PowerOutage.US keeps a running tally of outages across the United States, and it’s…
-
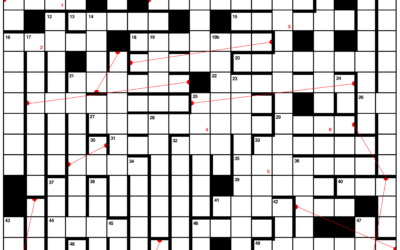
Data visualization crossword puzzle
This is fun. Lisa Charlotte Rost made a data visualization crossword puzzle. Print…
Recently for Members
Second Edition
 Visualize This: The FlowingData Guide to Design, Visualization, and Statistics (2nd Edition)
 Visualize This: The FlowingData Guide to Design, Visualization, and Statistics (2nd Edition)
New tools, refined process.
Browse by Chart Type See All →


