Visualization has been around for a few minutes, and while the tech, format, devices, and mediums change, we can still apply classic patterns in these new places.
details
-
Members Only
Overviewing and detailing
-
Members Only
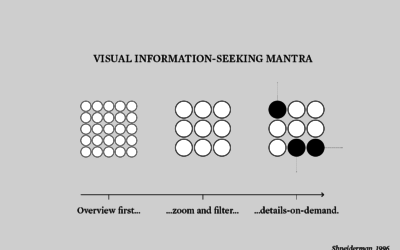
In the Details of the Data – Process 122
The best way to make charts more interesting is to provide lots of details, which requires more work on your end but pays off in the end result.
Recently for Members
Second Edition
 Visualize This: The FlowingData Guide to Design, Visualization, and Statistics (2nd Edition)
 Visualize This: The FlowingData Guide to Design, Visualization, and Statistics (2nd Edition)
New tools, refined process.
Browse by Chart Type See All →


