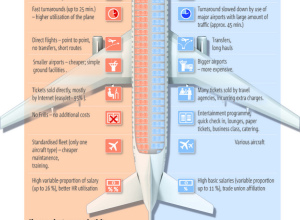
5W Graphics, whose work you’ve seen by now, compares lower-cost airlines to “regular”…
Nathan Yau
-
Why Are Cheap Airlines So Cheap?
-
Collect Data About Yourself with Twitter – your.flowingdata is Live
your.flowingdata (YFD), a Twitter application that lets you collect data about yourself, is…
-
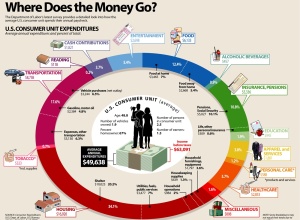
How Does the Average Consumer Spend His Money?
Add another graphic to the list of ways to show consumer spending. Visual…
-
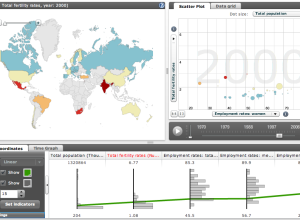
Explore World Data with Factbook eXplorer from OECD
The Organization for Economic Co-operation and Development (OECD) makes a lot of world…
-
Religious Teachings On Sex
This graphic on religious teachings and sex is making the social media rounds.…
-
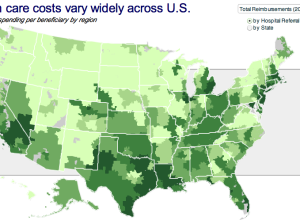
Health Care Costs Vary Widely By Region
No, this isn’t a bad fungus spreading northwest towards Washington. This map from…
-
Sneak Peek: New Version of your.flowingdata Coming Soon
The brand new version of your.flowingdata (YFD) is coming soon, and of course,…
-
Colored Tree, Cookies, and Stairs in Visualization Ad
These ads for Hospital Alemán from Saatchi & Saatchi color code physical items…
-
Is the Economy Getting Ready to Turn Around?
Is the economy going to turn around any time soon? How does this…
-
Realtime Information Graphics Show International Data Interchange
Zum Kuckuck, a design group in Germany, visualizes data interchange and network traffic…
-
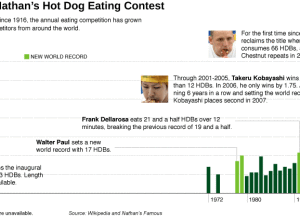
Who’s Going to Win Nathan’s Hot Dog Eating Contest?
It’s July 4 this weekend. You know what that means, right? It’s Independence…
-
X-Men Universe Relationship Map
Contrary to what a lot people might think they know from the movies,…
-
Infographic Provides a Twitter History Lesson
Manolith, in collaboration with InfoShots, tells the story of Twitter. The graphic starts…
-
Workshop: Visualization on the Web – Join Me at VisWeek
Visualization on the Web is growing, but a lot of the really good…
-
Review: RoamBi, Seeing Your Data on the iPhone
This is a guest review by Peter Robinet of Bubble Foundry, a web…
-
Michael Jackson Billboard Rankings: the Man, the Legend
Say what you want about Michael Jackson, but there’s no denying the great…
-
Friday Freebies: 1,000 Business Cards from AllBusinessCards
The folks over at AllBusinessCards have generously donated 1,000 business cards to three…
-
Quick Links for the Weekend – 26 June 09
Tufte’s Invisible Yet Ubiquitous Influence – Edward Tufte combines a policy wonk’s love…
-
Happy Second Birthday, FlowingData
Two years ago on June 25, 2007, I wrote the first post for…
-
Does this Calorie Intake Infographic Work? Not Really
How long does it take to burn off the calories from a Big…




 Visualize This: The FlowingData Guide to Design, Visualization, and Statistics (2nd Edition)


