A simulation to estimate how long until you are seated at a restaurant.
Nathan Yau
-
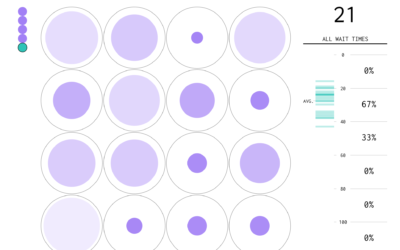
Waiting For a Table
-
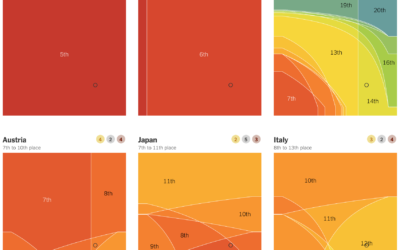
Who’s winning the medal race, depending on how you weight the medals
Every year, we look at the medal counts of each country. Who’s winning?…
-
The personal data you generate when you book a flight
Every time we book a flight, a Passenger Name Record is generated and…
-

Mikaela Shiffrin pulling away for gold
Mikaela Shiffrin won her first gold medal in PyeongChang with a fraction of…
-

Fantasy map generator
This is fun. It’s a fantasy map generator with the following rules:
Project… -
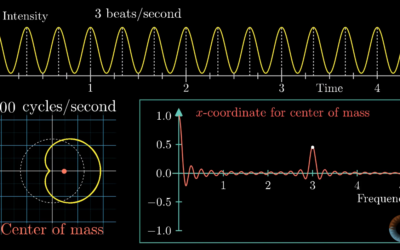
Visual introduction to the Fourier Transform
One of my least favorite electrical engineering courses in college was on signals…
-
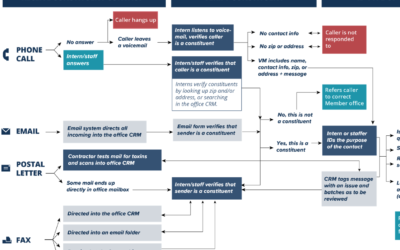
Where constituent input ends up
When you have input to send Congress, you have a number of communication…
-
FiveThirtyEight datasets available for download
If you’re looking for some data to play with, FiveThirtyEight just made it…
-

Olympian mechanics
Well this is awesome. The New York Times highlighted four olympians with a…
-

People font
You know those graphics that use icons of people to represent units or…
-
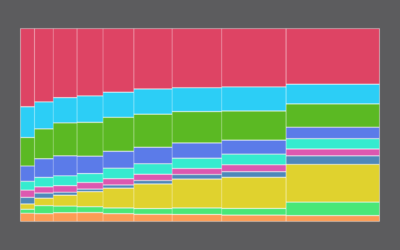
How Different Income Groups Spend Money
After living expenses, where does the money go, and how does it change when you have more cash available?
-

Olympians in your living room through augmented reality
Well this is awesome. The Winter Olympics start this Friday, and The New…
-
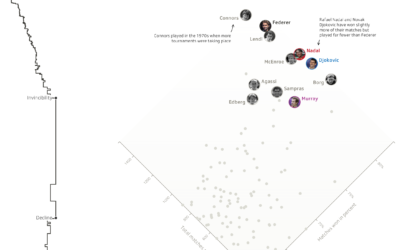
Roger Federer career in rankings and wins
Professional tennis player Roger Federer won his 20th Grand Slam title recently. He’s…
-
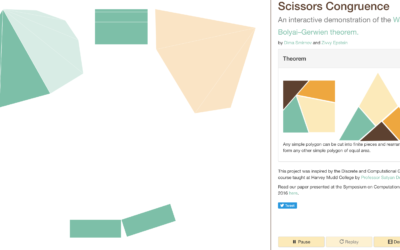
Scissors congruence
The Wallace–Bolyai–Gerwien theorem says that if you have two polygons of equal area,…
-

Statistics crash course
Odds are if you’re reading this, you know what statistics is already, but…
-
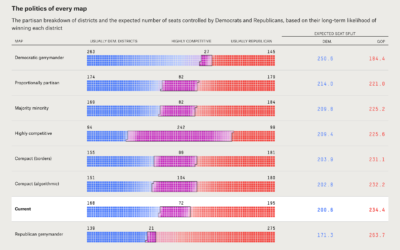
Redistricting the congressional map with different goals
FiveThirtyEight asks, “There’s a lot of complaining about gerrymandering, but what should districts…
-

Bruises
Musician Kaki King’s daughter suffers from a condition (Idiopathic Thrombocytopenic Purpura) where her…
-
Members Only
How I Made That: Animated Square Pie Chart
Also known as waffle charts. Using animated transitions between values, you can allow for comparisons between categories.
-
Link
Over Heard: A design exploration of the On Being archive →
The process of building a client project with varied expectations along the way.
-
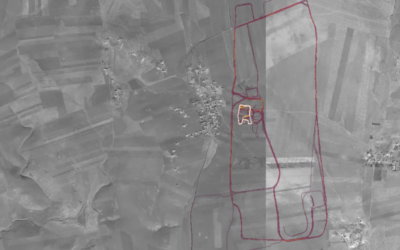
Secret army bases seen in public fitness tracking map
Last year, fitness tracking app Strava released a high detail map of public…
Recently for Members
Second Edition
 Visualize This: The FlowingData Guide to Design, Visualization, and Statistics (2nd Edition)
 Visualize This: The FlowingData Guide to Design, Visualization, and Statistics (2nd Edition)
New tools, refined process.
Browse by Chart Type See All →


