I have an affinity for new things designed as old things, so this brief history of data visualization by RJ Andrews hits the spot.
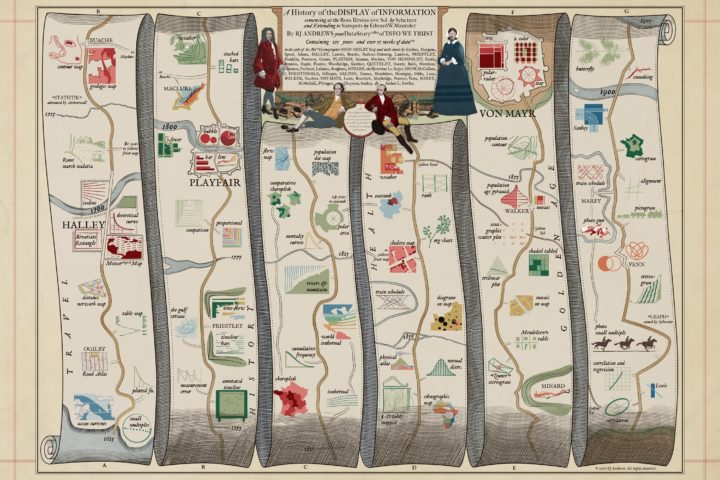
I have placed cartoons representing important works of data visualization along a fictitious scroll map in the style of Ogilby’s atlas. The road marches you through time, passing many charts, through towns (named for key contributors whose charts make up said towns), and over waterways that mark important dates.
If you’re interested in a comprehensive compendium, you should check out Michael Friendly’s Milestones project.
 Visualize This: The FlowingData Guide to Design, Visualization, and Statistics (2nd Edition)