With almost absolute certainty, every product dies a quick death once its warranty…
Nathan Yau
-

Warranty Expiration
-

Analysis: Do the shoes matter in marathon running?
Kevin Quealy and Josh Katz for The Upshot analyzed shoe and running data…
-
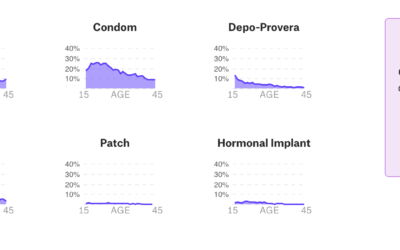
Data-centric view of birth control
Birth control is one of those topics often saved for private conversations, so…
-

Interactive to see street orientation everywhere
After seeing polar charts of street orientation in major cities, Vladimir Agafonkin, an…
-
Millions of internet-connected TVs track viewing habits
Sapna Maheshwari for The New York Times on Samba TV software running on…
-

Neural networks to communicate with Alexa devices using sign language
Many have found Amazon’s Alexa devices to be helpful in their homes, but…
-
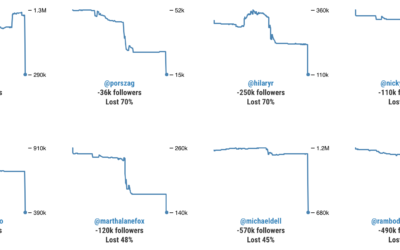
Twitter bot purge
With Twitter cracking down, some users are experiencing bigger dips in follower count…
-

Rush Hour puzzle solver and generator
The Rush Hour puzzle game was invented by Nob Yoshigahara in the 1970s…
-
Changing Twitter, with Statistics
Earlier this year, The New York Times investigated fake followers on Twitter showing…
-
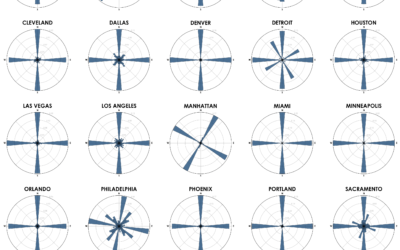
Street network orientation in major cities
Using OpenStreetMap data, Geoff Boeing charted the orientation distributions of major cities:
Each… -
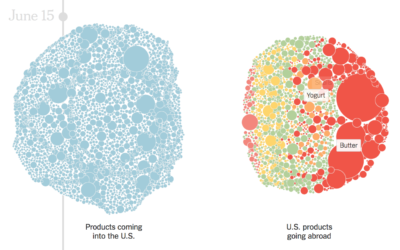
Products with tariffs in the trade war
The trade war started in January of this year when the administration imposed…
-
Doing good data science
Mike Loukides, Hilary Mason, and DJ Patil published a first post in a…
-

Composite image of a spider building its web
Christian Fröschlin combined 2,800 frames of a spider building its web for this…
-
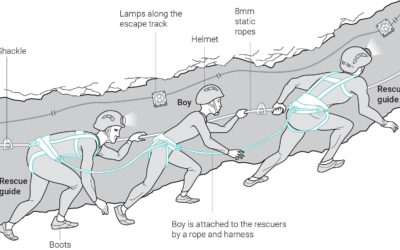
Graphics explaining Thai boys rescue
The eighth Thai boy was rescued from the flooded cave recently. Great news.…
-

Visualizing Patterns on Repeat
Things have a way of repeating themselves, and it can be useful to highlight these patterns in data.
-
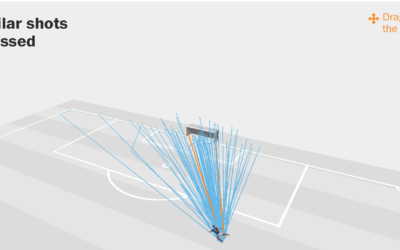
Expected versus actual goals in the World Cup
Benjamin Pavard from France made a low-probability goal the other day. Seth Blanchard…
-
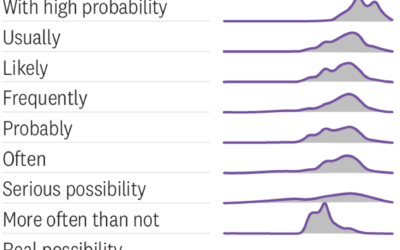
How people interpret probability through words
In the early 1990s, the CIA published internal survey results for how people…
-
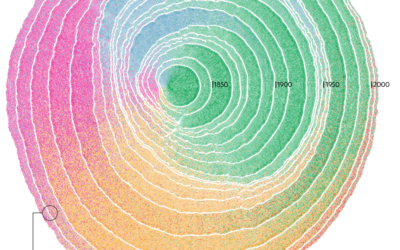
Immigration in the United States visualized as rings of tree trunk
Pedro M. Cruz, John Wihbey, Avni Ghael and Felipe Shibuya from Northeastern University…
-

A Diagram of All the Batteries
After an unsuccessful battery search, the natural next step was of course to look up battery sizes and chart all of them.
-

All the building footprints in the United States
Microsoft released a comprehensive dataset for computer-generated building footprints in the United States.…
Recently for Members
Second Edition
 Visualize This: The FlowingData Guide to Design, Visualization, and Statistics (2nd Edition)
 Visualize This: The FlowingData Guide to Design, Visualization, and Statistics (2nd Edition)
New tools, refined process.
Browse by Chart Type See All →


