Important question: Is animation in visualization even worthwhile? Well, it depends. Surprise, surprise. In this issue, I look at animation in data visualization, its uses, and how I like to think about it when I implement moving data.
Nathan Yau
-
Members Only

Uses for Animation in Charts and Animating Your Own Data
-
The Crime Machine
I’m behind on my podcast listening (well, behind in everything tbh), but Reply…
-
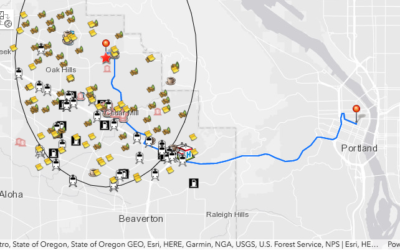
Finding a house to buy, using statistics
Atma Mani, a geospatial engineer for ESRI, imagined shopping for a house with…
-
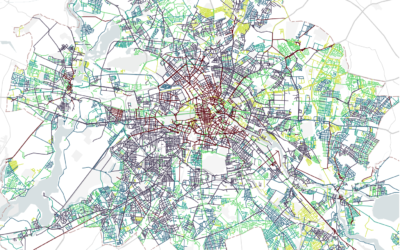
Street names as a proxy for history and culture
From Streetscapes by Zeit:
Street names are stories of life. They tell us… -
Visualization research for non-researchers
Reading visualization research papers can often feel like a slog. As a necessity,…
-
Members Only
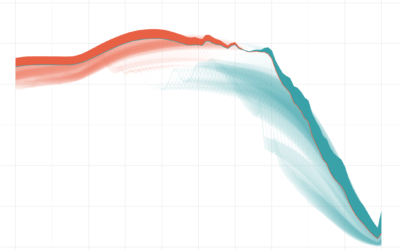
How I Made That: Animated Difference Charts in R
A combination of a bivariate area chart, animation, and a population pyramid, with a sprinkling of detail and annotation.
-

A collection of Charles-Joseph Minard’s statistical graphics
Charles-Joseph Minard, best known for a graphic he made (during retirement, one year…
-
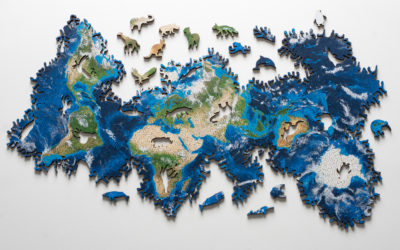
Earth puzzle without borders
The Earth Puzzle by generative design studio Nervous System has no defined borders.…
-
Members Only
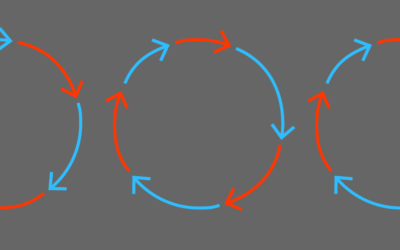
Election Visualization Circle of Life
Election night has become quite the event for newsrooms and graphics departments over the years, and the visualization production cycle has started to feel more familiar each time.
-
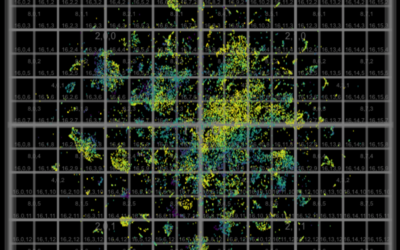
Millions of data points with deep scatterplots
Ben Schmidt uses deep scatterplots to visualize millions of data points. It’s a…
-
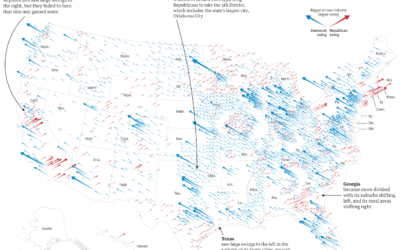
Midterm shifts versus the 2016 election
The Guardian goes with scaled, angled arrows to show the Republican and Democrat…
-

Cheap labor to power artificial intelligence
Artificial intelligence, given its name, sounds like a computer learns everything its own.…
-
Data Feminism
Data grows more intertwined with the everyday and more involved in important decisions.…
-
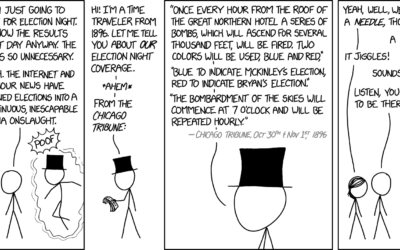
xkcd and the needle of probability
xkcd referenced the ever-so-loved forecasting needle. I’m so not gonna look at it…
-
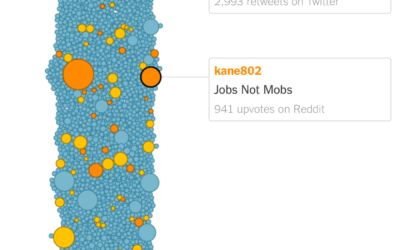
How a meme grew into a campaign slogan
A meme that cried “jobs not mobs” began modestly, but a couple of…
-
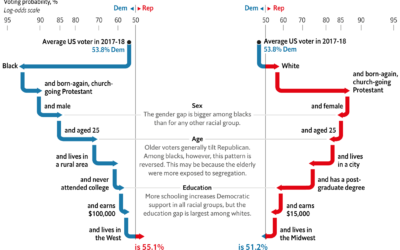
Demographic effects on voting intention
The Economist built an election model that treats demographic variables like blocks that…
-
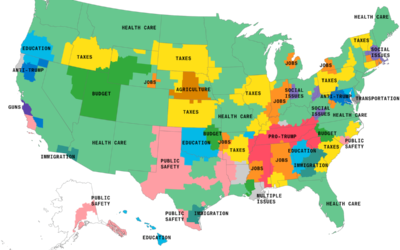
Maps of the issues mentioned most in election advertising
As the midterm elections loom, the ads focusing on key issues are running…
-

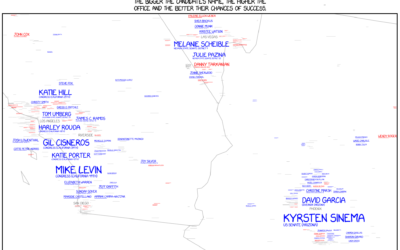
Faces of diverse midterms
As one might expect, many women, people of color, and L.G.B.T. candidates are…
-
xkcd maps 2018 midterm election challengers
Randall Munroe, Kelsey Harris, and Max Goodman for xkcd mapped all the challengers…
-
Members Only
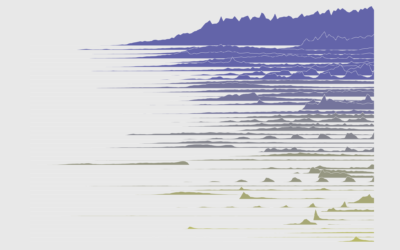
How to Make Frequency Trails in R
Also known as ridgeline plots, the method overlaps time series for a 3-D-ish view of the data. While perhaps not the most visually efficient, the allure is undeniable.
Recently for Members
Second Edition
 Visualize This: The FlowingData Guide to Design, Visualization, and Statistics (2nd Edition)
 Visualize This: The FlowingData Guide to Design, Visualization, and Statistics (2nd Edition)
New tools, refined process.
Browse by Chart Type See All →


