• Membership
  • Books
  • Projects
  • Learning
  • Newsletters
  • Member Login
  • Cash-poor millionaire households

    October 10, 2025

    Topic

    Statistical Visualization  /  Bloomberg, income, millionaire, spending

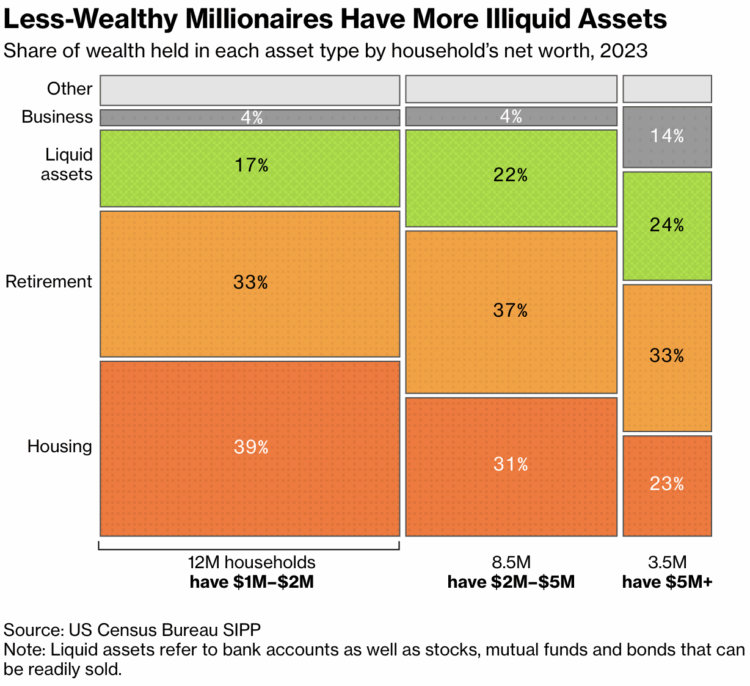
    Everyone loves reading about millionaires who don’t have enough liquidity to buy things, but the seven-figure status is not what it once was. For Bloomberg, Andre Tartar, Ben Steverman, and Stephanie Davidson show the increasing number of millionaire households who have most of their net worth tied up in housing and retirement accounts.

    The mosaic plot above breaks down assets by millionaire income groups. About half of households fall within the $1M to $2M range and only 17% of their net worth counts as liquid assets (in green). The liquid share increases with net worth.

    Cue the violins.

  • Odds against you in sports parlays, advantage house

    October 10, 2025

    Topic

    Statistical Visualization  /  betting, parlay, sports, uncertainty, Washington Post

    Parlays in sports betting are booming and people are losing billions of dollars to online sportsbooks, like FanDuel and DraftKings. For the Washington Post, Emily Giambalvo, Kati Perry, and Aaron Steckelberg show how the bets work with playable simulations.

    Like most gambling games, the odds are completely against you in the long run and virtually guarantee that sportsbooks get all your money.

    So instead of tossing your money into the sports machine, you can just run simulations. It’s not nearly as fun, but at least you’ll be able to watch sports again for the spirit of competition and love of the game.

  • Unreliable library of human knowledge

    October 9, 2025

    Topic

    Artificial Intelligence  /  Internet, Kurzgesagt, misinformation

    Kurzgesagt, popular for illustrative explainer videos on YouTube, describes the current situation with generative AI slop. There is a flood of random, fake videos on the rise.

    It is all fun and games at first, but when there is no way to distinguish between fake and real online, this useful internet thing turns into something else.
    Read More

  • Members Only

    Overviewing and detailing

    October 9, 2025

    Topic

    The Process  /  Ben Shneiderman, details, patterns

    Hi everyone. Nathan here. I write to you from the United States, where…

  • Mortality in the news vs. what we usually die from

    October 8, 2025

    Topic

    Statistical Visualization  /  mortality, news, Our World in Data

    Our World in Data compared causes of death in the United States against how much those causes are covered by the New York Times, Washington Post, and Fox News. The results are about what you would expect, based on coverage data from Media Cloud.

    Rarer events, like homicide and drug overdose, are reported more heavily, whereas everyday causes, like cancer and heart disease, are reported less.

    This, of course, is because the news covers things that are out of the ordinary, which is what readers and viewers are looking for on a by-the-minute timeline. Not many people care that mortality rates, which take more time to estimate than reporting on single events, are the same as yesterday.

    But, as residents of this planet, it is beneficial to know that life is not always getting worse. It’s good to get a reminder sometimes.

  • The Oatmeal reviews AI art

    October 7, 2025

    Topic

    Artificial Intelligence  /  art, Oatmeal

    Matthew Inman, the cartoonist who illustrates The Oatmeal, breaks down his feelings towards AI-generated art. When you remove the work, pain, mistakes, intention, and ultimately, the person from the art, the true value is lost.

  • Removing the process of creation

    October 7, 2025

    Topic

    Artificial Intelligence  /  Casey Neistat, creativity, OpenAI, slop, Sora

    OpenAI released Sora, which lets users easily generate videos with a prompt. The videos present in a TikTok-like feed and provides us with another source of endless scroll. Thank you, internet gods for your benevolence. Casey Neistat, known for his YouTube-ing, voices his concerns.
    Read More

  • Analysis of TikTok usage, transforming new users to power users

    October 7, 2025

    Topic

    Infographics  /  TikTok, usage, Washington Post

    As many of us have learned first-hand, TikTok (and its scrolling video ilk) is addictive and can pull people in to stare at their phones for hours. However, TikTok is secretive about how their viewing algorithm works. So the Washington Post recruited readers to track usage and send the data, which gave WaPo a sample of how the infinite scroll kept people watching over a six-month period.

    New users start with general music videos and the feed grows more specific. A few minutes per day can easily increase to hours. Your brain craves the dopamine all the time. It gets harder to interact with others. You can’t concentrate on bigger tasks. All in all, pretty amazing.

    Check out the full project, and then maybe delete TikTok.

  • ICE planning a surveillance system that integrates more data streams and 24/7 monitoring

    October 7, 2025

    Topic

    Data Sharing  /  government, privacy, surveillance, Wired

    Dell Cameron, for Wired, on the system currently in its planning phase:

    Throughout, ICE has leaned on Palantir’s Investigative Case Management system to combine disparate streams of data into a single investigative platform. Recent contract updates show the system lets agents search people using hundreds of categories, from immigration status and country of origin to scars, tattoos, and license-plate reader data. Each surveillance contract ICE signs adds another layer—location trails, social networks, financial records, biometric identifiers—feeding into Palantir’s hub. ICE’s new initiative is about scaling up the human side of the equation, stationing analysts around the clock to convert the firehose of data into raid-ready leads.

    I hope people really are realizing that our gift of data and attention to social media is not in our best interest.

  • LinkedIn sues company for fake bots

    October 6, 2025

    Topic

    Data Sharing  /  fake, lawsuit, LinkedIn, ProAPIs, scraping

    Suzanne Smalley reporting for The Record:

    Social media giant LinkedIn on Thursday filed a lawsuit against a company which it says operates a network of millions of fake accounts used to scrape data from LinkedIn members before selling the information to third parties without permission.

    ProAPIs, a software company, and its CEO Rahmat Alam allegedly run an operation which LinkedIn says charges customers up to $15,000 per month for scraped user data taken from the social media platform.

    Millions.

    I drop in to LinkedIn sometimes, and it often feels like bots talking to bots or people using bot-generated “content” to fill the void. I wonder how much data ProAPIs scraped was bot-generated, which was then flipped for a monthly fee so that other bots can push more “content” into the LinkedIn machine. That seems like a terrible feedback loop to get stuck in.

  • Millions of pounds of canceled food aid in the US

    October 6, 2025

    Topic

    Infographics  /  food, government, ProPublica

    The administration cut $500 million of aid to U.S. food banks earlier this year, which amounts to 94 million pounds in 4,300 deliveries. This is based on data from the Department of Agriculture. For ProPublica, Ruth Talbot and Nicole Santa Cruz illustrated each canceled delivery with a truck.

    The data is itemized down to pounds of food and where it would’ve gone, so each truck represents something tangible. A counter on the top shows how many cancellations you’ve scrolled through.

  • Passed peak social media, maybe

    October 3, 2025

    Topic

    Statistical Visualization  /  Financial Times, John Burn-Murdoch, social media

    As we descend towards slop-based social media, where the videos are fake and the people are bots, we might be rounding up our time with algorithmically generated feeds. For Financial Times, John Burn-Murdoch shows time spent on social media over the past decade.

    The key signal seems to be in young people’s usage. It looks like usage plateaued for 16- to 24-year-olds and has been inching its way down. Although usage over two and a half hours per day is still a lot. Also when broken out by continent, North American usage still looks like it’s going up.

    So I guess we’ll see. Bookmarked for later.

  • Getting more news from the TikTok

    October 3, 2025

    Topic

    Statistical Visualization  /  Pew Research, social media, TikTok

    Pew Research surveyed U.S. adults about news consumption on social media and found a steep increase for TikTok users.

    When looking at adult TikTok users specifically, news consumption has also increased sharply in recent years. More than half of TikTok users (55%) now say they regularly get news on the platform, up from 22% in 2020. TikTok is now on par with several other social media sites – including X (formerly Twitter), Facebook and Truth Social – in the share of its adult users who regularly get news there.

    From 22% to 55% is indeed a big jump. I wonder how much of that jump is from TikTok users’ shifting preferences and how much is from a shifting TikTok feed algorithm.

  • Undelivered USAID medical supplies and medicine

    October 2, 2025

    Topic

    Infographics  /  health, USAID, Washington Post

    Earlier this year, the administration halted USAID shipments of antimalarial and HIV medical supplies. Medicine already paid for just sat in warehouses. The Washington Post charted the timeline for the disrupted supply chain.

    A Post analysis of internal data from the first half of the year shows that supplies valued at more than $190 million were scheduled to arrive at distribution warehouses by the end of June. Instead, the analysis found, shipments worth nearly $76 million were not delivered, including the majority of medication needed to combat severe malaria. Some medicines never left the places where they were manufactured, and others were stranded in ports or customs facilities near the cities and villages where they were needed.

    One part of the larger piece is a set of circles that represent shipments. Circles are sized by value and colored by shipment status during a given month. Position represents shipment location and changes as you scroll.

    The mechanics remind me of the 2019 piece on school diversity, also by the Post.

  • Data Underload  /  alcohol

    How Much Alcohol Americans Drink

    Just under half of adults in the United States said they had an alcoholic beverage in the past 30 days. Does this change for various groups? If so, by how much?

    Read More
  • Members Only

    When a table is better than a graph

    October 2, 2025

    Topic

    The Process  /  table

    Hi everyone. Nathan here. I write to you from the United States, where…

  • Merriam-Webster announces their new LLM

    October 1, 2025

    Topic

    Artificial Intelligence  /  dictionary, humor, Merriam-Webster

    Merriam-Webster is about to release the next edition of their large language model in November. No hallucinations, hundreds of thousands of well-defined parameters. I’m excited.

    We are thrilled to announce that our NEW Large Language Model will be released on 11.18.25.

    [image or embed]

    — Merriam-Webster (@merriam-webster.com) October 1, 2025 at 7:38 AM

  • Census data down

    October 1, 2025

    Topic

    Data Sharing  /  Census Bureau, government, shutdown

    Due to the government shutdown, parts of the Census Bureau site, where you should be able to access data, are currently offline.

  • Length of government funding gaps

    September 30, 2025

    Topic

    Statistical Visualization  /  funding, government, NBC News, shutdown

    The government shutdown of 2025 begins. Here is a quick table by Nigel Chiwaya for NBC News showing the congressional parties and the length of the funding gaps. Not all gaps include shutdowns and furloughs for federal employees, but the last six have, and the last shutdown in 2018 was the longest.

  • Government shutdowns and disagreements in federal funding

    September 30, 2025

    Topic

    Statistical Visualization  /  funding, government, Lazaro Gamio, New York Times

    As one might expect, Congress is having trouble figuring out how to fund the government, which is likely headed towards a shutdown. For the New York Times, Lazaro Gamio charted the history of funding, lapses, and shutdowns.

    Congress is supposed to pass 12 spending bills every year before October 1, and they’ve only been able to do it five times since the rule began in the 1970s. They don’t seem to be getting better at it.

  • Page 1 of 403
  • 1
  • 2
  • 3
  • 4
  • 5
  • 6
  • ...
  • 403
  • >

Get access to courses, tutorials, and more resources.

Become a member →

Recently for Members

October 9, 2025
Overviewing and detailing

October 2, 2025
When a table is better than a graph

September 25, 2025
Visualization Tools, Datasets, and Learning Resources – September 2025 Roundup

September 18, 2025
Real bits, part 2

September 11, 2025
Making of: Salary and Occupation beeswarm charts

Second Edition

Visualize This: The FlowingData Guide to Design, Visualization, and Statistics (2nd Edition)

New tools, refined process.

Order: Amazon / Bookshop

Browse by Chart Type See All →

Step Chart Beeswarm Dot Map Treemap Bar Chart Race Frequency Trails Bar Chart Gantt Chart Voronoi Diagram Density Plot

Browse By Topic

  • Visualization

    Seeing data

  • Maps

    Seeing geographic data

  • Infographics

    Explaining data

  • Networks

    Connecting data

  • Statistics

    Analyzing data

  • Software

    Working with data

  • Sources

    Getting data

  • Design

    Making data readable

Made by FlowingData

  • The Process

  • Data Underload

  • Chart Everything

  • Guides

  • Books

  • Shop

  • About
  • Contact
  • LinkedIn
  • Instagram
  • Bluesky
  • RSS
Copyright © 2007-Present FlowingData. All rights reserved.