Hannah Fry and her group at University College London investigate data from the…
-
Predicting riots
-
Movie sounds
Moviesound is a goofy yet charming look at sounds in movies. Imagine sound…
-

Make your own US rivers and roads maps
Inspired by Nelson Minar’s map of US rivers, Mike Bostock demonstrates how to…
-
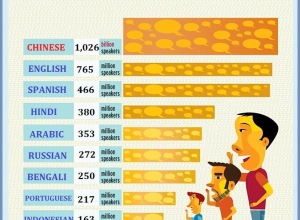
What is wrong with these charts?
Whoa. There are a lot of things wrong with this chart. Gold star…
-
Getting started with visualization after getting started with visualization
Here’s where to go next once you’ve covered the basics of visualization. When it’s time to actually start making things.
-

Economist spotting
It was surprisingly hard for me to find a physical copy of this…
-
Link
R spells for data wizards
Thomas Levine provides a handful of useful tips for those getting started with R.
-
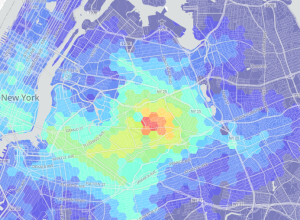
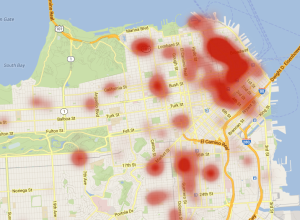
Transit times in NYC
As more New Yorkers move farther away from Manhattan, transit times grow in…
-
Visualizing uncertainty still unsolved problem
Vivien Marx in Nature Methods:
Data from an experiment may appear rock solid.… -
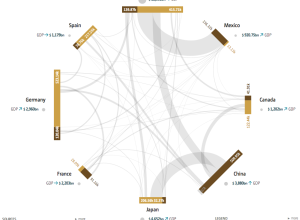
Global migration and debt
Global Economic Dynamics, by the Bertelsmann Foundation in collaboration with 9elements, Raureif, and…
-
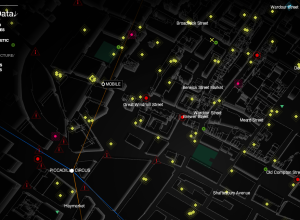
An eerie view of the linked city
Watch_Dogs is a video game that imagines Chicago as a city where everyone…
-
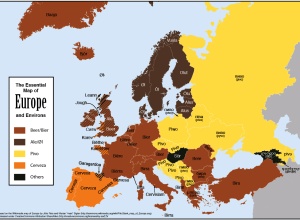
Map shows how to say “beer” in Europe
Feòrag NicBhrìde provides a handy map on how to say beer in European…
-
Link
Statistics for Point Pattern Analysis in the Real World
Lillian Pierson provides a summary of methods to measure distance and clustering in a spatial context.
-
Members Only
Small Maps and Grids
Maybe you want to make spatial comparisons over time or across categories. Organized small maps might do the trick.
-
Dictionary of Numbers extension adds context to numbers
We read and hear numbers in the news all the time, but it…
-
Reading the data
The Economist covered a handful of visualization books in this week’s issue, and…
-
A people-centric view of your Gmail inbox
Immersion by the MIT Media Lab is a view into your inbox that…
-
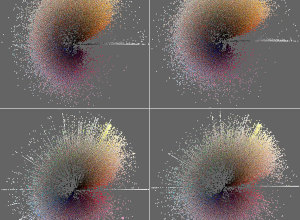
Instagram cities
The collaborative project Phototrails is a visual exploration of millions of Instagram photos,…
-
Yelp maps words used in reviews
We typically think of Yelp reviews as aggregates on a restaurant or business-specific…
-
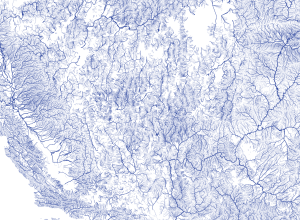
Mapping all the rivers in the United States
Inspired by Ben Fry’s All Streets map, which showed every road in the…
Recently for Members
Second Edition
 Visualize This: The FlowingData Guide to Design, Visualization, and Statistics (2nd Edition)
 Visualize This: The FlowingData Guide to Design, Visualization, and Statistics (2nd Edition)
New tools, refined process.
Browse by Chart Type See All →


