Shirt available on Threadless. I seriously need some infographic tees. Too bad the…
-
Friday, I’m in love…
-

Explorations of real-world traffic
We don’t often get to see how cars, trains, airplanes, etc move in physical space, because, well, we’re usually in them.
-
TransparencyData makes campaign finance data easier to access
Anyone who’s looked at campaign finance data knows it can get messy really…
-
Crowdsourcing Johnny Cash
Aaron Koblin (along with Chris Milk) is up to his crowdsourcing mischief again.…
-
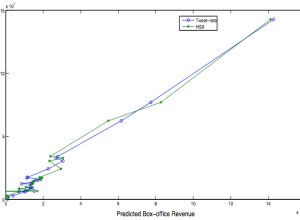
Twitter predicts the future?
A recent study [pdf] by Sitaram Asur and Bernardo A. Huberman at HP…
-

Data visualization tutorial in Processing
If you absolutely refuse to touch any code, I suggest Many Eyes or…
-
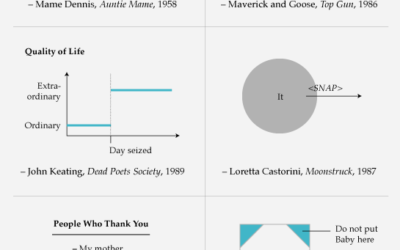
Data Underload #17: Famous Movie Quotes, p. 2
Carpe diem. Seize the data, boys. Make your lives extraordinary.…
-
The making of wine – in motion graphics
Designer Tiago Cabaco explains the conception of wine in this short animated infographic.…
-
Viegas+Wattenberg announce visualization startup
Big news. Former IBMers Fernanda Viegas and Martin Wattenberg just announced their new…
-
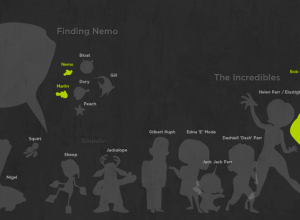
100 Pixar characters drawn to scale
Designer Juan Pablo Bravo illustrates 100 Pixar characters to scale, from Wally B.…
-
Swing vote effects explored with swingometer
With the 2010 UK elections coming up, the Guardian explores possible outcomes, given…
-
Watching the Growth of Walmart
The ever so popular Walmart growth map gets an update, and yes, it still looks like a wildfire. Sam’s Club follows soon after, although not nearly as vigorously.
-
Best of FlowingData – March 2010
March was a really good month for FlowingData. Thanks again everyone for sending…
-
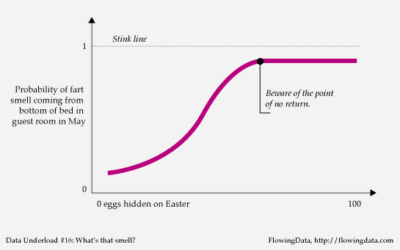
Data Underload #16 – What’s that smell?
It’s all fun and games until someone gets hurt.…
-
Best place to catch a cab? Try Bloomingdale’s
Matthew Bloch, Ford Fessenden, and Shan Carter continue the New York Times geographic…
-

Weekend fodder – arm and a leg
Affording Health Care – Some weirdness going on with the area chart on…
-
Edward Tufte on his White House appointment
Edward Tufte was officially appointed to a White House advisory role a few…
-
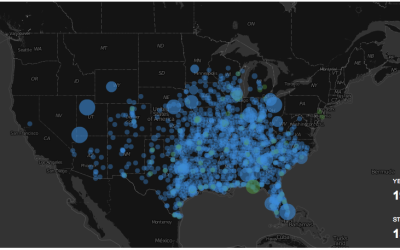
Location check-ins during South by Southwest
Location-aware apps are the hot topic nowadays, and with all the tech-oriented people…
-
Map and report data with InstantAtlas
As you know, there’s this big wave of transparency going on right now,…
-
Streamgraph code is available and open source
Some people love ’em and others hate ’em. Now you can play with…
Recently for Members
Second Edition
 Visualize This: The FlowingData Guide to Design, Visualization, and Statistics (2nd Edition)
 Visualize This: The FlowingData Guide to Design, Visualization, and Statistics (2nd Edition)
New tools, refined process.
Browse by Chart Type See All →


