Cristobal Vila, inspired by, well, numbers and nature, Vila animates the natural existence of Fibonacci sequences, the golden ratio, and Delaunay triangulation. Watch it. Even if you don’t know what those three things are, the video will rock your socks off.
-
Dreaming in numbers
-

Nutritional facts redesigned
Nutrition facts labels are uniform across products, but let’s imagine for a second that you could do whatever you want, just as long they showed certain bits of information. FFunction takes a stab at redesigning the standard milk carton under this premise.
-
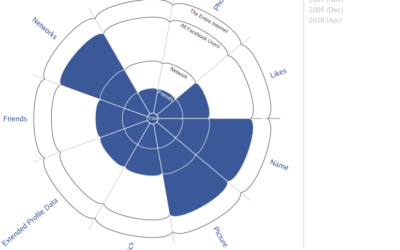
Evolution of Facebook privacy policies
There’s been a lot of hullabaloo about Facebook’s newly installed privacy policies. It…
-
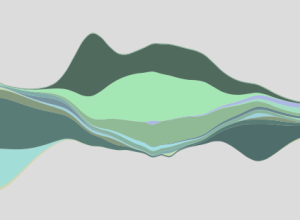
Streamgraph code ported to JavaScript
Lee Byron open-sourced his streamgraph code in Processing about a month ago. Jason Sundram has taken that and ported it to JavaScript, using Processing.js.
-

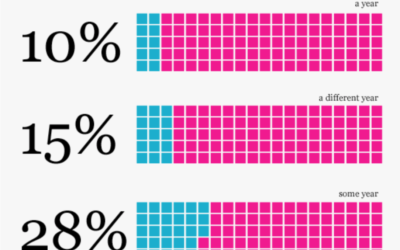
Graph labels are for chumps
Yeah, it’s Friday.
-
Tracking the oil spill
For those following the status of the oil spill, the New York Times…
-
The Boom of Big Infographics
Big information graphics have been around for a long time. They’ve come in…
-
Best of FlowingData – April 2010
In case you missed them or are new to FD, here are the top posts from the last month, based on a combination of views and comments. The Walmart map came back to life recently with new data and a feature on CNNMoney.
-
IBM Visual Communications Lab has an opening
There are a lot of job opportunities out there for visualization people. This…
-
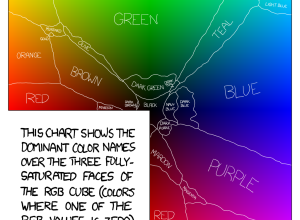
How men and women label colors
Along the same lines of Dolores Labs’ color experiment, Randall Munroe of xkcd…
-
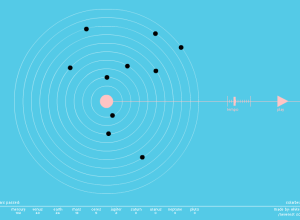
Planets make sweet music together
SolarBeat is an audiolization by Whitevinyl that makes music with the planets. Each…
-

The (nerdy) data-driven life
Gary Wolf, of Wired and The Quantified Self, describes personal data collection and…
-
Design for America deadline approaching
Just a quick note. Sunlight Labs’ Design for America contest is coming up…
-
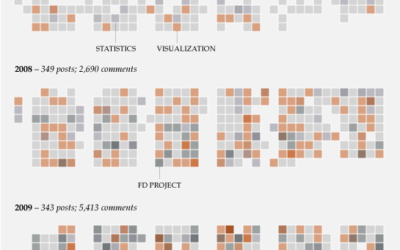
Data Underload: One Thousand Posts
On June 25, 2007 I published the first FlowingData post. Today, here is…
-

Weekend Fodder – Death and Taxes
Death and Taxes: 2011 poster – Jess’ annual look at government spending has…
-
Find out whose Twitter fans are dumber
Stupid Fight compares fans on Twitter using “stupid indicators” like “OMG” and number…
-
Cultural colors of emotion and character
Some colors represent different things in different parts of the world, while others…
-
Seeing the art in cartography
In much of the same spirit of the recent Cartographies of Time, the…
-
Connections among Twitter employees
Because you can never get enough Twitter visualizations, Jason Stirman takes a look…
-
Challenge: Graphing obesity trends
Here we have a case of worthwhile data and an interesting story about…
Recently for Members
Second Edition
 Visualize This: The FlowingData Guide to Design, Visualization, and Statistics (2nd Edition)
 Visualize This: The FlowingData Guide to Design, Visualization, and Statistics (2nd Edition)
New tools, refined process.
Browse by Chart Type See All →


