The Internet Archive makes millions of digitized books available in the form of…
Network Visualization
Fun with links, nodes, and edges.
-
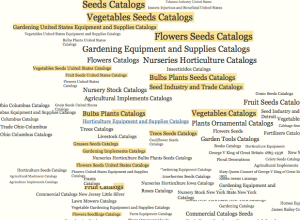
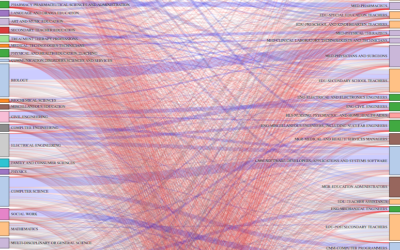
Map of book subjects on Internet Archive
-
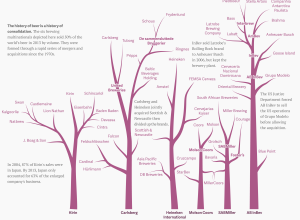
Beer family tree
With Anheuser-Busch InBev rumored to have an interest in acquiring SABMiller and SABMiller…
-
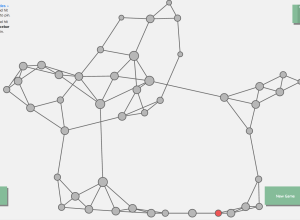
Network visualization game to understand how a disease spreads →
Vax, a game by Ellsworth Campbell and Isaac Bromley, explores how a disease…
-
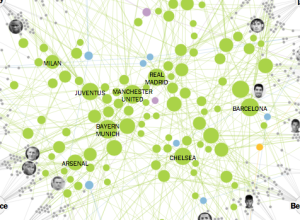
Clubs that connect World Cup national teams →
Gregor Aisch for the New York Times explored how the soccer clubs that…
-
Careers after the college degree
Ben Schmidt, an assistant professor of history at Northeastern University, was curious about…
-
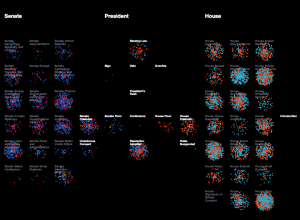
Lawmaking through the House and Senate visualized
Researchers at the University of Washington’s Center for American Politics and Public Policy…
-
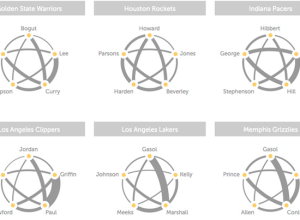
NBA passing dynamics
With player tracking installed in all of the NBA arenas, the sports analytics…
-
Find new beers to drink
Based on reviews from BeerAdvocate, Beer Viz, a visualization class project, asks you…
-
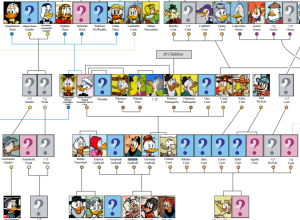
Donald Duck family tree
The Donald Duck family tree is huge. Who knew? Above is only a…
-
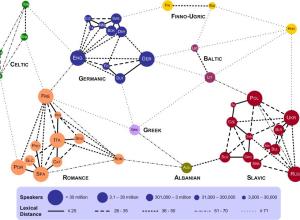
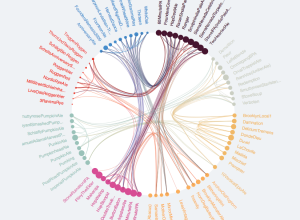
Lexical distance between European languages
Using data from linguistics research by Kostiantyn Tyshchenko, Teresa Elms clustered European languages…
-
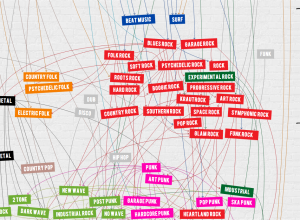
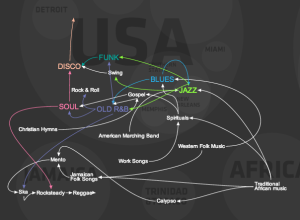
Timeline shows a century of rock history
Jessica Edmondson visualized the history of rock music, from foundations in the pre-1900s…
-
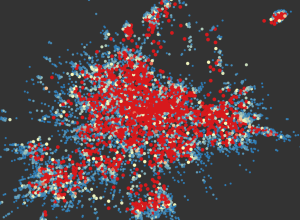
Network of subreddits
There are over 5,000 subreddits with plenty of overlap and similarities. Randy Olson…
-
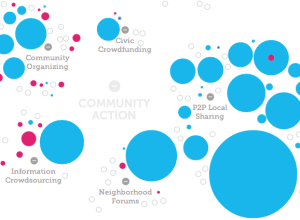
Growth in civic tech
Fathom Information Design, in collaboration with the Knight Foundation and Quid, visualized the…
-
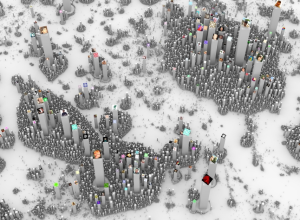
Online habitats
Ekisto, by visual artist Alex Dragulescu, is an experiment in visualizing online communities…
-
Evolution of western dance music
A quick animated look on the evolution of western dance music, a mixture…
-
10 seconds of extreme trading
The video below shows ten seconds of trading on Blackberry on October 2,…
-
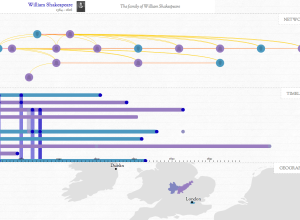
British relationships throughout history
In Kindred Britain, Nicholas Jenkins, Elijah Meeks and Scott Murray provide a visual…
-
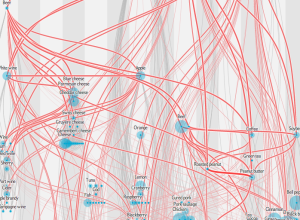
Network of shared flavors
Jan Willem Tulp, for this month’s Scientific American food issue, recreated the flavor…
Recently for Members
Second Edition
 Visualize This: The FlowingData Guide to Design, Visualization, and Statistics (2nd Edition)
 Visualize This: The FlowingData Guide to Design, Visualization, and Statistics (2nd Edition)
New tools, refined process.
Browse by Chart Type See All →


