I’m just gonna put this xkcd comic right here.…
xkcd
-
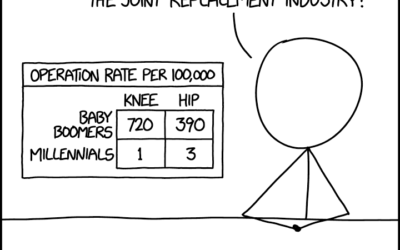
Cohort and age effects
-

xkcd and the needle of probability
xkcd referenced the ever-so-loved forecasting needle. I’m so not gonna look at it…
-
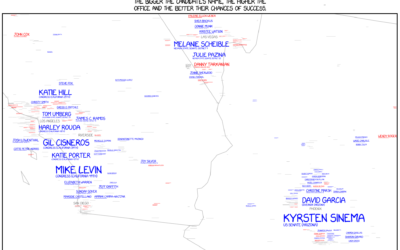
xkcd maps 2018 midterm election challengers
Randall Munroe, Kelsey Harris, and Max Goodman for xkcd mapped all the challengers…
-
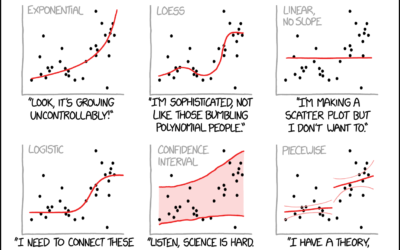
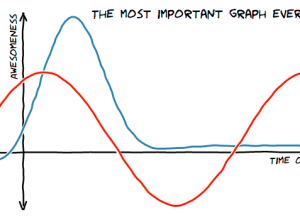
xkcd: Curve-fitting messages
xkcd tells it like it is.…
-
xkcd: Disaster Movie
From xkcd, a blockbuster idea right here.…
-
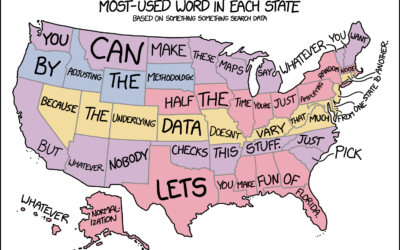
xkcd: Words in every state map
xkcd reading my mind somehow as usual. Not all state word maps are…
-
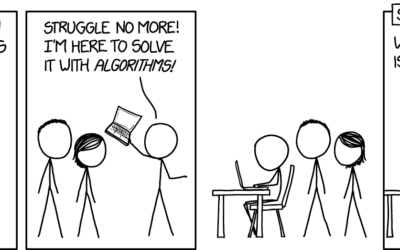
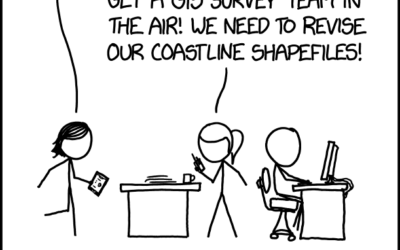
xkcd: Algorithms are hard
Yeah, but what if you combine and overlay all these datasets? [xkcd]…
-
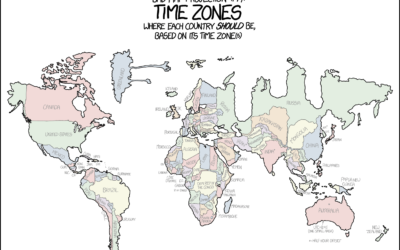
xkcd: Projecting country borders by time zone
Time zones are odd sometimes.…
-
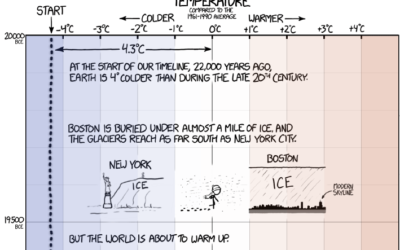
xkcd: Earth temperature timeline
In classic xkcd-fashion, Randall Munroe timelines the Earth’s temperature, dating back to 20,000…
-
Missing 11th of the month
David Hagan looked closer at why the 11th of the month appeared to…
-
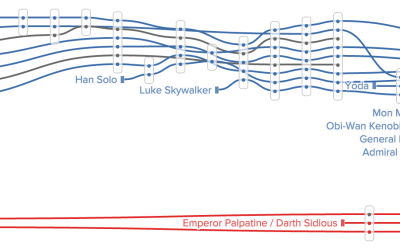
Timelines show Star Wars character interactions
Remember when xkcd charted character interactions for fictional stories? Inspired by that and…
-
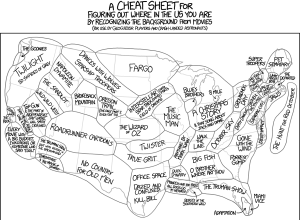
xkcd: U.S. of movie backgrounds
xkcd sectioned the United States by the background in movies. Because xkcd.…
-
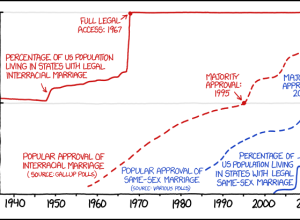
Interracial and same-sex marriage parallels
xkcd doing what xkcd does. Randall Munroe charts a brief timeline of interracial…
-
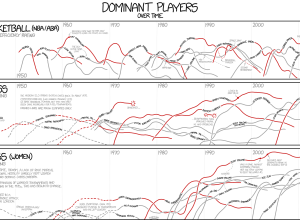
xkcd: Dominant players in chess and basketball →
I’m pretty sure xkcd is the only one who gets away with showing…
-

Monty Hall xkcd →
Nice one, xkcd.…
-
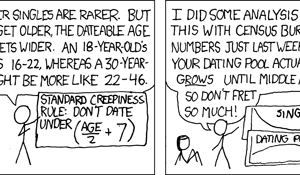
xkcd: Growing dating pool
An old one from xkcd. I’m not sure whether to laugh or cry,…
-
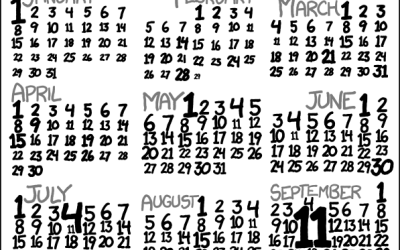
xkcd: Calendar of meaningful dates
Using the Google ngrams corpus, xkcd sized the days of the year based…
-
xkcd-style charts in R, JavaScript, and Python
The ports and packages to make your charts look like they came from…
-
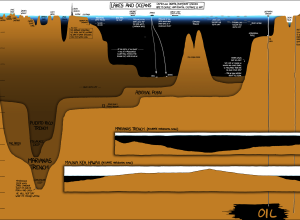
Under the Sea, Under the Sea
In usual xkcd fashion, Randall Munroe plots the depths of lakes and oceans,…
-
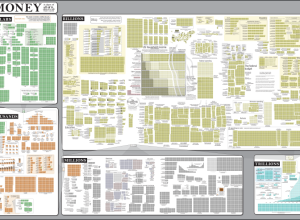
xkcd: Cost of everything
Randall Munroe of xkcd charts the things that money pays for, from the…
Recently for Members
Second Edition
 Visualize This: The FlowingData Guide to Design, Visualization, and Statistics (2nd Edition)
 Visualize This: The FlowingData Guide to Design, Visualization, and Statistics (2nd Edition)
New tools, refined process.
Browse by Chart Type See All →


