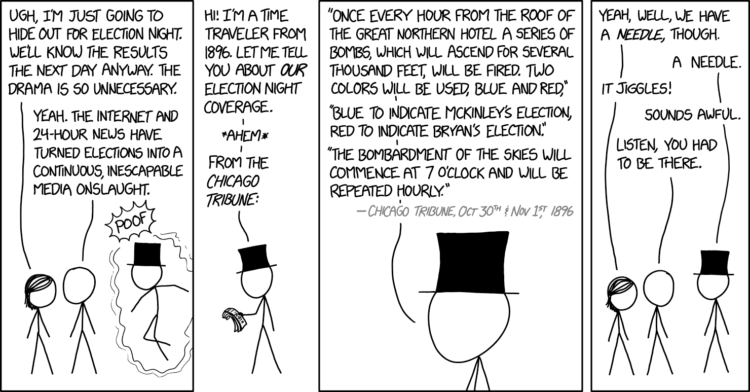
xkcd referenced the ever-so-loved forecasting needle. I’m so not gonna look at it this year. Maybe.
xkcd and the needle of probability
Second Edition
 Visualize This: The FlowingData Guide to Design, Visualization, and Statistics (2nd Edition)
 Visualize This: The FlowingData Guide to Design, Visualization, and Statistics (2nd Edition)
New tools, refined process.