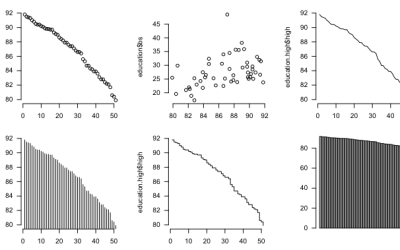
Make a lot of charts at once, line them up in a grid, and you can make quick comparisons across several categories.
R
-
Members Only

Small Multiples in R
-
Link
healthvis
The healthvis R package tries to make creation of interactive graphics easier by rendering in D3.
-
Members Only
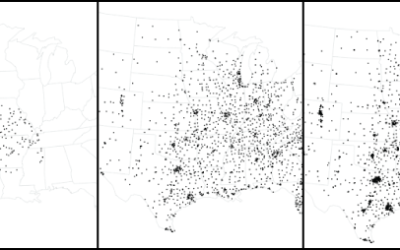
How to Make an Animated Growth Map in R
Although time series plots and small multiples can go a long way, animation can make your data feel more real and relatable. Here is how to do it in R via the animated GIF route.
-
Members Only
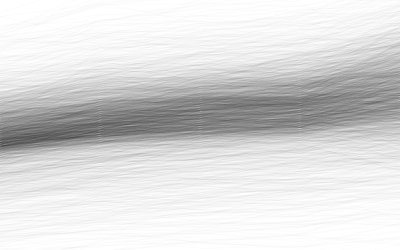
Using Transparency in R to Improve Clarity
When you plot a lot of data at once, points and lines can obscure others and hide patterns. Transparency can help reveal what is really there.
-
Link
Animated GIFs in R →
-
Link
R and Data Mining: Examples and Case Studies →
Download the book as a PDF with R code supplement
-
Data Analysis (with R) on Coursera
Jeff Leek, an Assistant Professor of Biostatistics at the Johns Hopkins Bloomberg School…
-
Getting Started with Charts in R
You get a lot of bang for the buck with R, charting-wise, but it can be confusing at first, especially if you’ve never written code. Here are some examples to get started.
-
Link
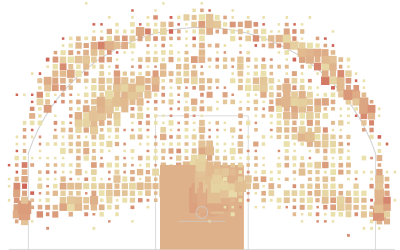
Finding image color palettes in R →
Use k-means to find most used colors
-
Link
Rcpp →
Write C++ code and easily connect with R for more speed [via]
-
Archive of datasets bundled with R
R comes with a lot of datasets, some with the core distribution and…
-
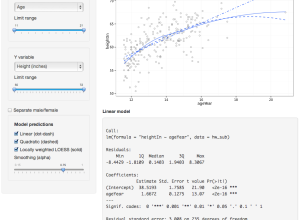
Shiny allows web applications with R
RStudio, the folks behind the IDE for R released last year, continues to…
-
Link
Watching Sandy in R →
Code to make a hurricane map [via]
-
xkcd-style charts in R, JavaScript, and Python
The ports and packages to make your charts look like they came from…
-
Link
R Programming Efficiency →
Slidedeck on how to write more efficient code
-
Members Only
More on Making Heat Maps in R
You saw how to make basic heat maps a while back, but you might want more flexibility for a specific data set. Once you understand the components of a heat map, the rest is straightforward.
-
Members Only
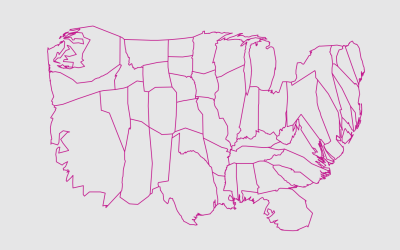
Mapping with Diffusion-based Cartograms
Sometimes these cartograms can distort areas beyond recognition, but they can also provide a better visual representation for a region with a wide range of subregions. At the least, they’re fun to look at.
-
Members Only
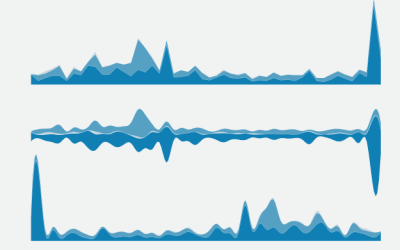
How to Make Stacked Area Charts in R
From the basic area chart, to the stacked version, to the streamgraph, the geometry is similar. Once you know how to do one, you can do them all.
-
Link
HiveR →
-
Link
Padding a Time Series in R →
Script to fill in the gaps between unevenly spaced points
Recently for Members
Second Edition
 Visualize This: The FlowingData Guide to Design, Visualization, and Statistics (2nd Edition)
 Visualize This: The FlowingData Guide to Design, Visualization, and Statistics (2nd Edition)
New tools, refined process.
Browse by Chart Type See All →


