I have two course-related updates on FlowingData. First, there’s a new course on…
clarity
-
New Visualization in R Course, and Other Updates
-
Members Only

Charting for Others (The Process 086)
There’s a new tool-agnostic course now available for members. Check it out now.
-
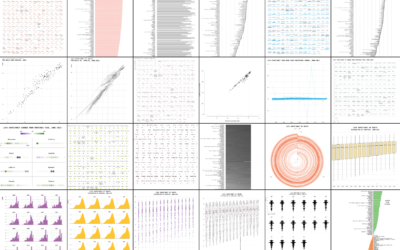
One Dataset, Visualized 25 Ways
“Let the data speak” they say. But what happens when the data rambles on and on?
-
Members Only
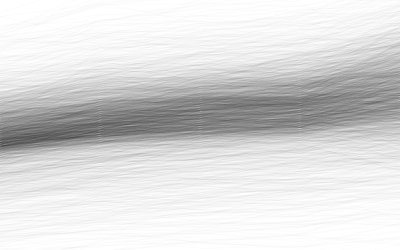
Using Transparency in R to Improve Clarity
When you plot a lot of data at once, points and lines can obscure others and hide patterns. Transparency can help reveal what is really there.
Recently for Members
Second Edition
 Visualize This: The FlowingData Guide to Design, Visualization, and Statistics (2nd Edition)
 Visualize This: The FlowingData Guide to Design, Visualization, and Statistics (2nd Edition)
New tools, refined process.
Browse by Chart Type See All →


