There are two main reasons annotation is often a challenge. The first is…
d3js
-
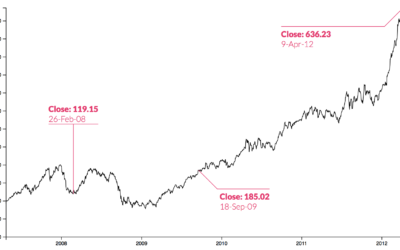
Making annotation easier with d3.js
-
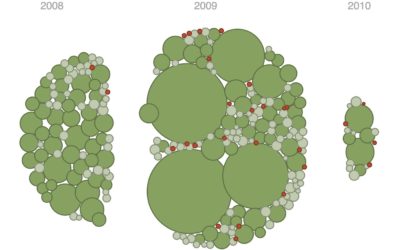
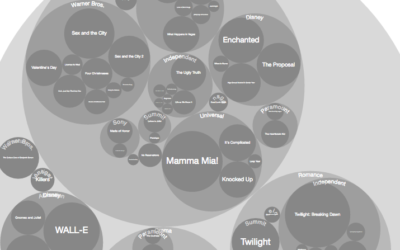
Floaty bubble charts with d3.js
D3.js, or Data-Driven Documents, version 4.0 was released a few months ago, so…
-
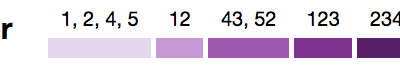
Using clustering to make a color scale
Choice of color scale can make a big difference in how the data…
-
Learning R Versus d3.js for Visualization
For those who work with R and d3.js, the differences between the two…
-

Showing missing data in line charts
Missing data is everywhere. Or, I guess technically it’s nowhere. You know what…
-
D3 in Depth
D3 is the most commonly used JavaScript library for visualization on the web,…
-
Members Only
Make a Moving Bubbles Chart to Show Clustering and Distributions
Use a force-directed graph to form a collection of bubbles and move them around based on data.
-
D3 4.0 released
I typically don’t care much about code releases, but every interactive chart I…
-
5 Tips for Learning to Code for Visualization
Here are some tips to get you started, based on my own experiences with R, and more recently, the JavaScript library d3.js.
-
Link
Animate gradient to imitate flow with d3.js →
Gain a sense of direction from otherwise static connections.
-
Link
d3.geo.statePlanes →
Nice projections for US states in D3.
-
Link
What Makes Software Good? →
Thoughtfulness in design from d3.js maker Mike Bostock. One of the main reasons I go with d3.js over other libraries.
-
Members Only
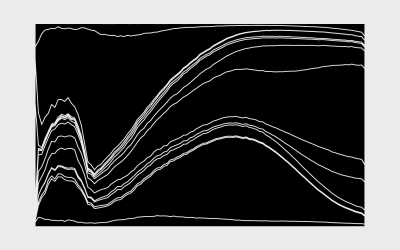
How to Make an Interactive Stacked Area Chart
Stacked area charts let you see categorical data over time. Interaction allows you to focus on specific categories without losing sight of the big picture.
-
Link
How do you learn d3.js? →
Small projects. Decide what you want to make first, and then figure out how to do it.
-
Link
k-means + d3.js →
The simple clustering technique implemented with d3.js.
-
Members Only
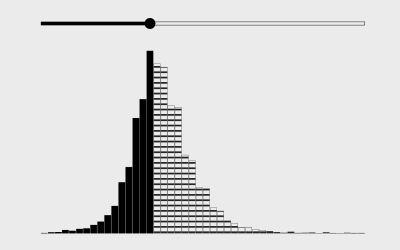
How to Make an Interactive Bar Chart With a Slider
Provide a slider for the standard bar chart so that users can shift focus to a point of interest.
-
Link
d3-jetpack →
Forgot about this. The d3-jetpack from Gregor Aisch makes some of the more tedious tasks in d3.js a bit shorter and intuitive.
-
Link
Mike Bostock AMA →
The creator of d3.js is answering questions on reddit right now. Saving for later, as I am sure there will be many interesting bits.
-
Members Only
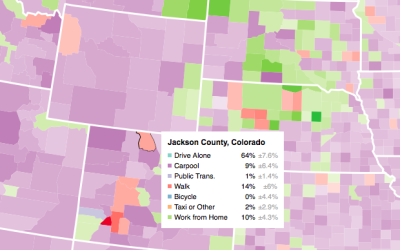
Making an Interactive Map with Category Filters
Let readers focus on the regions they care about to make their own comparisons and conclusions.
-
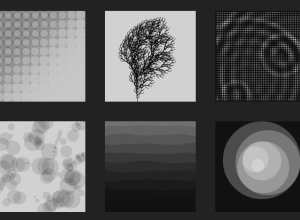
One animated art piece per day, with D3.js
Data-Driven Documents, or D3.js, is a flexible JavaScript library that lets you draw…
Recently for Members
Second Edition
 Visualize This: The FlowingData Guide to Design, Visualization, and Statistics (2nd Edition)
 Visualize This: The FlowingData Guide to Design, Visualization, and Statistics (2nd Edition)
New tools, refined process.
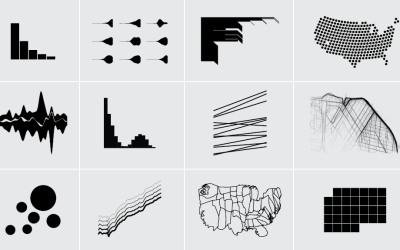
Browse by Chart Type See All →


