The New York Times mapped the slow, wide-reaching flood waters this year so…
climate change
-
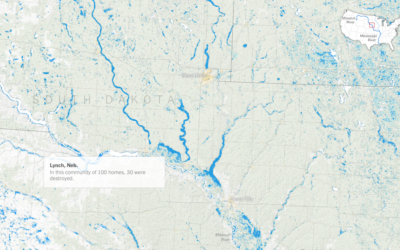
Sprawling flood waters across the Midwest and South
-
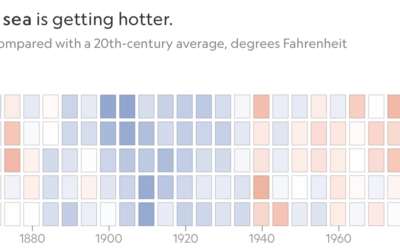
Increasing ocean temperatures, decreasing ice
For National Geographic, Kennedy Elliot made a series of heatmaps that show the…
-
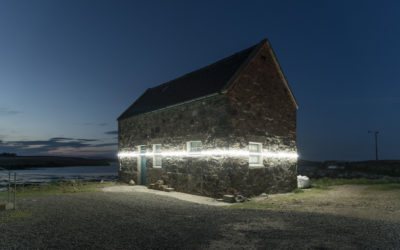
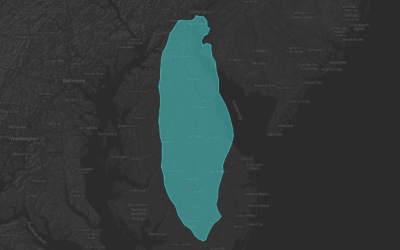
Light installation shows future water lines against existing structures
Timo Aho and Pekka Niittyvirta used sensors, LED lights, and timers to display…
-
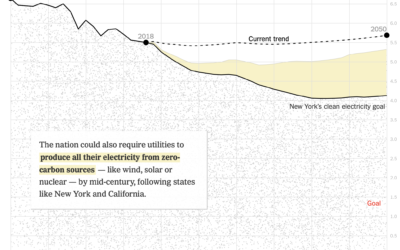
How fast emissions would reduce if other plans were adopted
The United States is doing pretty poorly in reducing emissions. For The New…
-
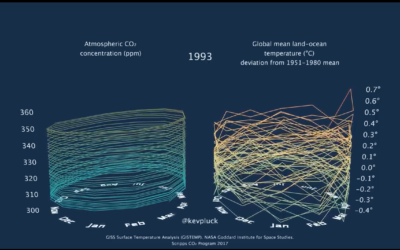
3-D tube chart of global CO2 concentration and temperature
Because you can never have enough time series charts that show increases of…
-
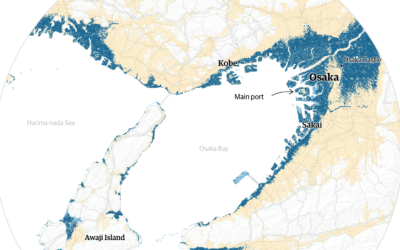
Cities projected to be under water by 2100
Using Climate Central sea-level rise estimates, The Guardian plots and maps the potential…
-
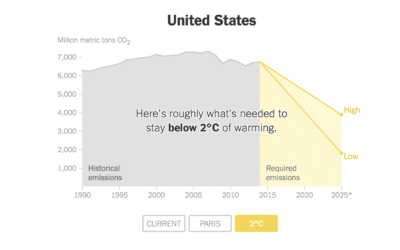
Carbon emissions goals vs. current paths
Brad Plumer and Nadja Popovich reporting for The New York Times:
Under the… -
Iceberg scale, as described in different countries
A giant iceberg broke off from Antartica. Like, really big. Quartz collected the…
-
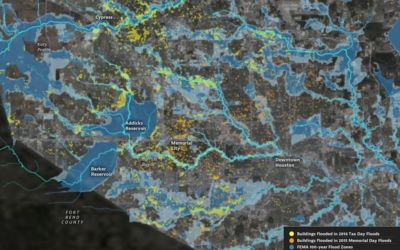
Houston flooding on the rise
Climate change is doing some weird stuff. What were once rare weather events…
Recently for Members
Second Edition
 Visualize This: The FlowingData Guide to Design, Visualization, and Statistics (2nd Edition)
 Visualize This: The FlowingData Guide to Design, Visualization, and Statistics (2nd Edition)
New tools, refined process.
Browse by Chart Type See All →


