After their graphic for thirty years of floods, Axios follows up with thirty years of Atlantic hurricanes. Each area represents the wind speed and time of a hurricane, and color represents the category.
Thirty years of hurricanes
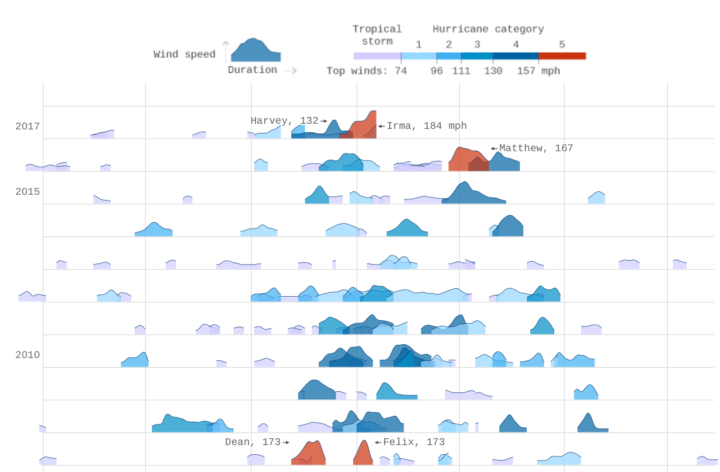
Chart Type Used

Second Edition
 Visualize This: The FlowingData Guide to Design, Visualization, and Statistics (2nd Edition)
 Visualize This: The FlowingData Guide to Design, Visualization, and Statistics (2nd Edition)
New tools, refined process.