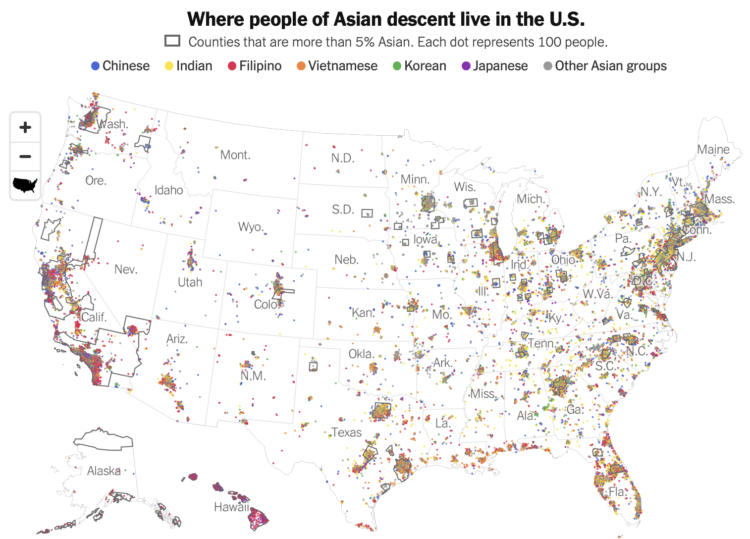
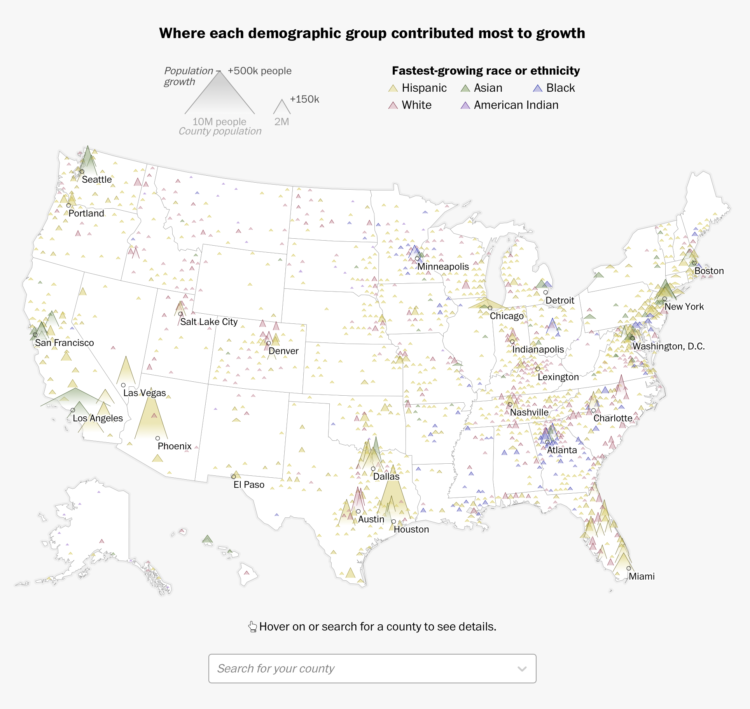
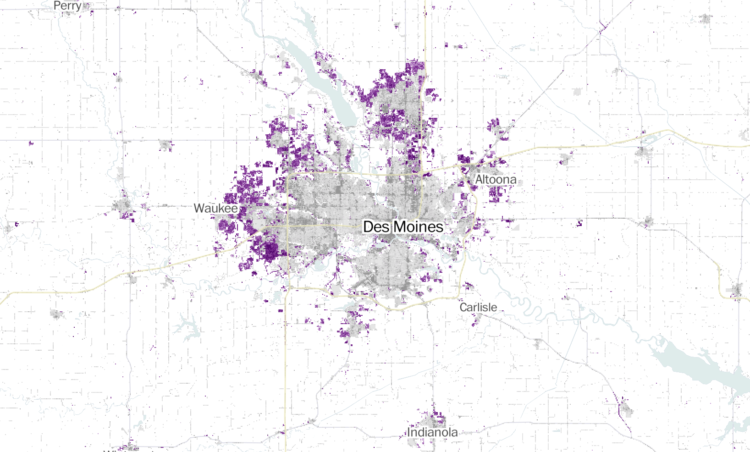
Robert Gebeloff, Denise Lu and Miriam Jordan for The New York Times looked at overall increases and variation within the Asian population:
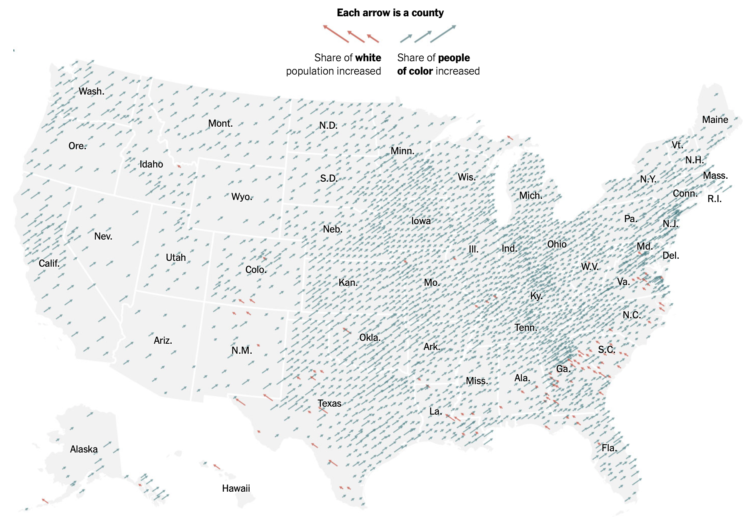
North Dakota, South Dakota, Texas, North Carolina and Indiana are among states that experienced major growth in the past decade. And people of Asian descent have been settling in ever larger numbers in states like West Virginia, where the overall population has declined.


 Visualize This: The FlowingData Guide to Design, Visualization, and Statistics (2nd Edition)


