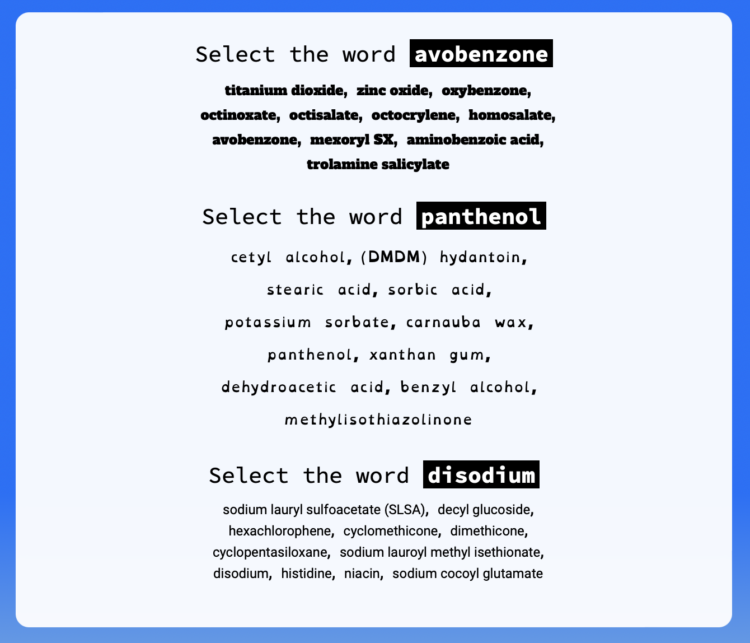
-
Members Only
-
Serena Williams announced her retirement from professional tennis. As is required for any milestone by a great athlete, a step chart from The New York Times shows her world ranking over time.
I like the focus on the higher rankings, which is fitting for the occasion, and dotted lines that indicate the smaller chunks of time Williams ranked below 20.
-
We hear about electric vehicles being the future, but for that to happen, people eventually need to be able to drive long distances without getting stranded. For Bloomberg Green, Kyle Stock and Jeremy C.F. Lin frame this in the context of American summer road trip. If you drive a non-Tesla EV, you’re going to run into some challenges.
-
Using a combination of satellite imagery, crowdsourced databases, and analyses, The New York Times identified airstrips used for illegal mining in Brazil:
To confirm these locations and connect them with illicit mining, Times reporters built a tool to help analyze thousands of satellite images. They examined historical satellite imagery to determine that 1,269 unregistered airstrips still appeared in active use within the past year. They documented telltale signs of mining nearby, such as clear cut areas of rainforest and pools that miners use to separate dirt from ore. And they determined that hundreds of the airstrips in mining areas are within Indigenous and protected lands, where any form of mining is against the law.
-
People disagree whether the United States is in a recession or not, because there isn’t a generalized formula you can just plug some numbers into. Instead, the translation of of many economic indicators to a binary definition is more complicated. For The Washington Post, Alyssa Fowers and Kevin Schaul report on work from the National Bureau of Economic Research.
A set of baseline charts show how indicators currently compare to past recessions. Things feels worse, but some indicators show better days. The pandemic, surprise, makes these current times more of a challenge to define.
-
For Bloomberg, Marie Patino reports on the shifting design choices for mapping weather extremes. The rainbow color scheme and sunny icons aren’t cutting it anymore.
-
For Reuters, Travis Hartman, Ally J. Levine, and Anurag Rao describe the measures taken to protect giant sequoia trees from wildfire. The trees have their own protections with thick bark and dropped branches. Firefighters help by watering the ground underneath and directing giant flames to other areas.
I’m into the vintage-y illustration. It starts you at the top of the tree and guides you down the trunk to the ground, with highlights along the way.
-
As city centers heat up, people search for cooler areas. For Bloomberg Green, Laura Millan, Hayley Warren and Jeremy Scott Diamond mapped the neighborhoods for a handful of hot cities that have something to cool the area:
Satellite images produced by the European Space Agency, working in part with data from NASA and the US Geological Survey, now have a high enough resolution to allow for temperature variations to be parsed on a street-by-street level. These snapshots of heat differences offer clear evidence of cooling strategies that can counteract what researchers term the “urban heat island effect,” in which city temperatures get that extra boost.
Bodies of water, greenery, and reflective surfaces.
-
This visual explorer by Rachel Binx lets you see Amtrak routes and stations in the United States. Click on a route. See the stations.
Seeing the routes laid out like this kind of makes me want to take a ride? I rode Amtrak years ago, and it wasn’t my favorite, but maybe it’s different now. I don’t know, I’m still envying the train network in Europe.
-
Recently published in Nature, research by Chetty, R., Jackson, M.O., Kuchler, T. et al. suggests that economic connectedness, or friendships between rich and poor, could improve economic mobility. The researchers used Facebook connection data from 70.3 million users, along with demographic and income data. NYT’s The Upshot explains the relationships with a collection of maps and charts.
You can find an anonymized, aggregated version of the data through the Social Capital Atlas. Also, I am very much into this socially-focused use of social media data.
-
Who is the most famous person born in the place you live? This interactive map by Topi Tjukanov lets you answer that question for anywhere in the world. The pool of possible people comes from a cross-verified database of 2.29 million people, based on Wikipedia entries and Wikidata. You can also see the most notable person per category: culture, science, leadership, and sports.
See also The Pudding’s U.S. map from 2019 that showed the most notable person who lived in each city.
-
This European travel map by Benjamin Td shows how far you can travel in five hours, given a station location. Just hover over the map, and you see the areas, or isochrones that are reachable in five hours, assuming 20 minutes for interchanges.
The project is based on data from Deutsch Bahn, and was inspired by a more dotty map by Julius Tens. It reminds me of Tom Carden’s (now Flash-retired) travel time map from 2008.
I wonder what this would look like for the United States, but I am also a little scared to know.
-
With tonight’s Mega Millions jackpot estimated at $1.28 billion, you might be wondering what the odds of winning are, even if you know the chances are super slim for an individual. (On the other hand, the more tickets purchased overall, the greater the chances that someone in the country wins.) For The Washington Post, Bonnie Berkowitz and Shelly Tan made a playful quiz to test your perception of 1 in 302.6 million.
-
DALL-E is an AI system from OpenAI that creates images from text. You can enter very random things and get very real-looking output. So of course someone entered “data visualization in the style of insert-anything-here” for a wide array of inspiration. I’m partial to the bar chart made out of cake.
-
Members Only
-
Christopher Flavelle, for The New York Times, reported on the lack of support from the Federal Emergency Management Agency for those who were displaced by natural disasters. Area charts by Mira Rojanasakul show how much the support has been lagging.
-
RStudio, the company behind the IDE of the same name, are changing their name to Posit:
Our charter defines our mission as the creation of free and open source software for data science, scientific research, and technical communication. This mission intentionally goes beyond “R for Data Science”—we hope to take the approach that’s succeeded with R and apply it more broadly. We want to build a company that is around in 100 years time that continues to have a positive impact on science and technical communication. We’ve only just started along this road: we’re experimenting with tools for Python and our new Quarto(opens in a new tab) project aims to impact scientific communication far beyond data science.
It doesn’t seem that long ago when I heard about some new IDE for R that might make programming easier. It’s been cool to see the company grow over the years, and I take it as an indicator for the growth of data work in general, which goes beyond the software or a single language.
-
In 2012, Thomas Davenport and DJ Patil outlined a budding career choice called “data science” where people, with a combination of programming and statistics, made sense of “big” datasets. For Harvard Business Review, Davenport and Patil revisit the career ten years later:
A decade later, the job is more in demand than ever with employers and recruiters. AI is increasingly popular in business, and companies of all sizes and locations feel they need data scientists to develop AI models. By 2019, postings for data scientists on Indeed had risen by 256%, and the U.S. Bureau of Labor Statistics, predicts data science will see more growth than almost any other field between now and 2029. The sought-after job is generally paid quite well; the median salary for an experienced data scientist in California is approaching $200,000.
So data science is looking pretty strong.
At the time of their first article, I was writing my dissertation and finishing my PhD in statistics. I wondered what I was going to do after. Statisticians, including me, were resistant to data science, or at the least had mixed feelings about it. They felt they were already doing it, so there was no need for a new field of study. Plus, statistician was already declared the “sexy” job of the decade three years prior. We still had time left.
I don’t hear those arguments anymore. There were overlapping skills to start, and the overlap seemed to increase over time. The label seemed to grow less important, as statisticians became data scientists and data scientists learned more analysis.
When people ask me what I do, I don’t say that I’m a statistician. I just say I help interpret data, and if I’m pressed, I say that I make a lot of charts.
-
This is a story about pizza, geometry, and making sure you get what you paid for.