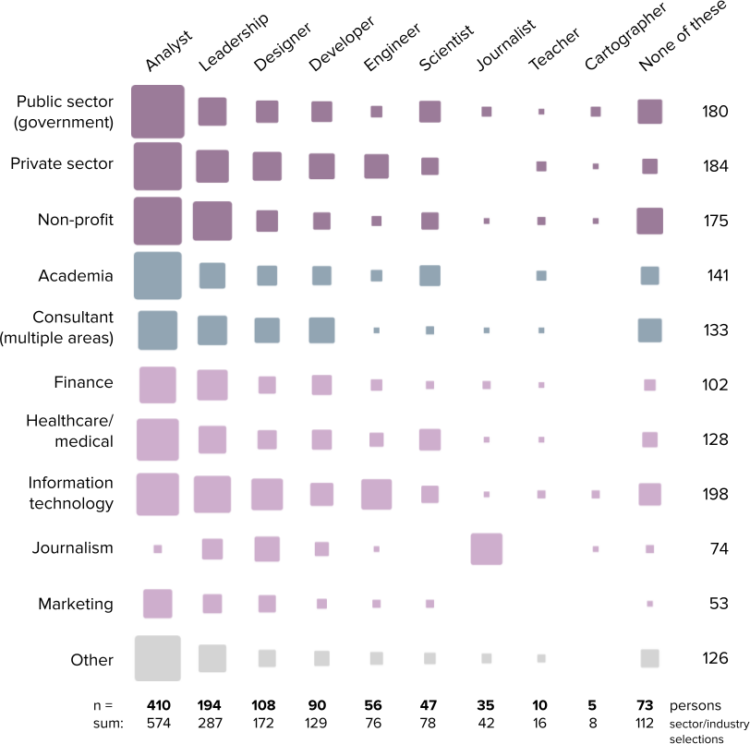
The 2022 results from the State of the Industry survey, run by the Data Visualization Society, are out. Among 1,218 respondents, see the roles, the salaries, and the responsibilities:
The overall median of the annual compensation graphs is at $60,000 to $79,999 per year, with very few respondents reporting over $159,000 per year, and a small but notable increase in the number of respondents reporting annual compensation in the $240,000 per year or more category.
I’d have to look at the actual data, which you can get for this year and previous, but my hunch that the split distribution in salary is between non-tech and tech workers.


 Visualize This: The FlowingData Guide to Design, Visualization, and Statistics (2nd Edition)
