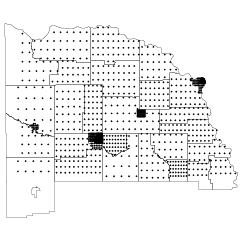
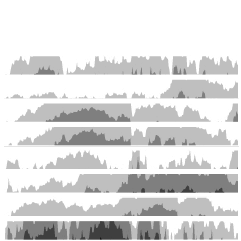
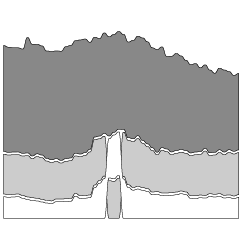
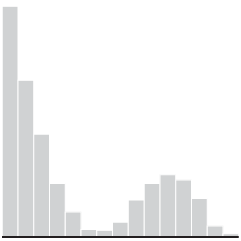
Interactive Travel Time and House Price Maps – Tom from Stamen recently announced some really slick mapping. They’re very attractive and very responsive. Sidenote: Look forward to a guest post from Tom in the near future.
175+ Data and Information Visualization Examples and Resources – Meryl has posted an extensive list of visualization examples and resources available online. Thanks for linking here, Meryl!
GPSed – A site that takes advantage of the data available from your mobile phone, mainly pictures and your GPS trace.
Visualizing the History of Living Spaces – Ivanov et al. discuss the challenges of visualizing motion data from 215 motions sensors in a large office building.
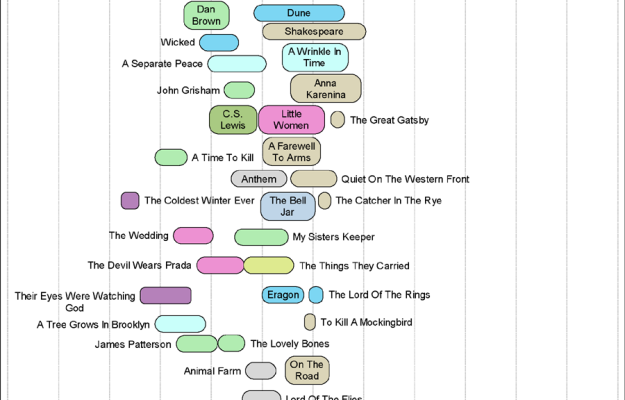
 is pretty far to the right. Nice.
 In its continued efforts for absolute power over all information ever created in the world, Google will be hosting open-source scientific datasets at its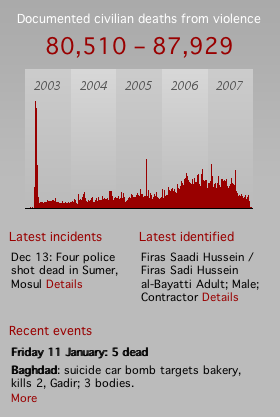
 You’ve probably already noticed (unless you’re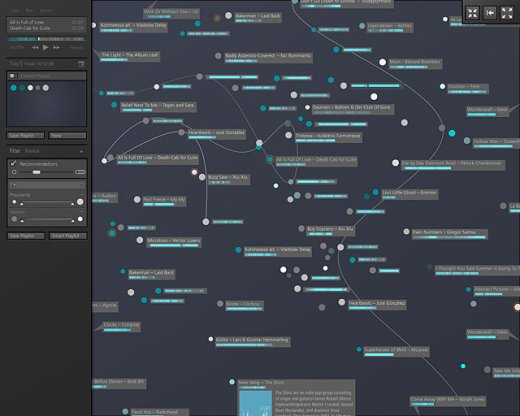
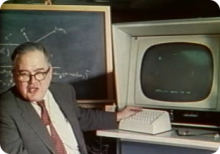 With the start of a new year, it only seems right to open with John Tukey and his work with interactive graphics. In 1972, when computers were giant and screens were green, John Tukey came up with PRIM-9, the first program to use interactive dynamic graphics to explore multivariate data. PRIM-9 allowed picturing, rotation, isolation, and masking. In other words, PRIM-9 allowed users to see multivariate data from different angles and identify structures in a dataset that might otherwise have gone undiscovered (kind of like the more recent
  Visualize This: The FlowingData Guide to Design, Visualization, and Statistics (2nd Edition)