![]() Tom from Stamen Design and Hadley from the GGobi group kindly pointed me to the recently ported Flare visualization toolkit. Developed by Berkeley’s Jeffrey Heer, Flare looks extremely useful for anyone who is interested in developing interactive visualizations (e.g. time series, stacked bar, pie charts, graph) for the Web that run in the Adobe Flash player.
Tom from Stamen Design and Hadley from the GGobi group kindly pointed me to the recently ported Flare visualization toolkit. Developed by Berkeley’s Jeffrey Heer, Flare looks extremely useful for anyone who is interested in developing interactive visualizations (e.g. time series, stacked bar, pie charts, graph) for the Web that run in the Adobe Flash player.
There’s a pretty good tutorial that I, as a beginner, found straightforward. I ran into some problems when I was trying to “import a library into another project,” but per Jeffrey’s suggestion, I upgraded to Adobe Flex 3 beta (currently a free download). That cured my problems. Adobe Flex is apparently still a little rough around the edges. Oh right, and the tutorial provides instructions on how to develop with Flare in the Flex Builder environment.
I’m currently going through the demos to gain a better understanding of both Flare and Actionscript, and it looks very promising. I’m pretty excited about what I can do once I’ve improved my Actionscript programming skills.
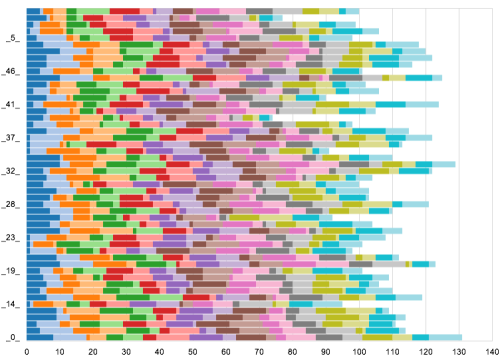
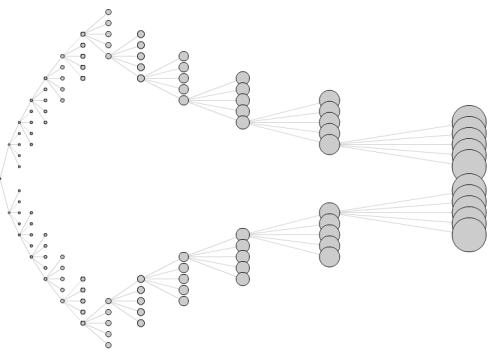
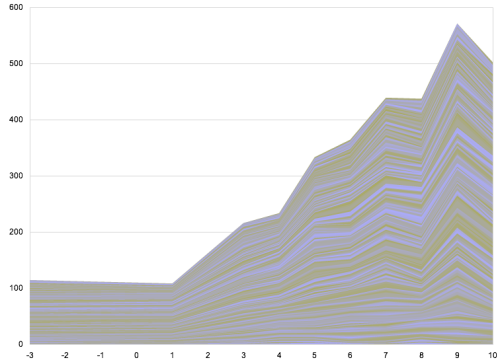
Check out some screenshots from the Flare demo reel after the jump.
 Visualize This: The FlowingData Guide to Design, Visualization, and Statistics (2nd Edition)
Here is the hyperlink.
I can’t believe I missed the link. Updated. Thanks, Daniel.
I’ve had the same issue with the tutorial on Flex2, so I downloaded Flex3. But the code highlighting and the eclipse panel graphics are all messed up… did u have the same problem? Tx
When I upgraded I had some weird problems, so I uninstalled Flex2 and Flex3 and then re-installed Flex3. That seemed to do the trick.
thanks very much – that worked for me too! xxx
Thanks so much, hopefully I can use it in my site
Thanks so much, hopefully I can use it in my site
Sound very interesting… downloading….
This should be helped a lot for my concept course :)
Sound very interesting… downloading….
This should be helped a lot for my concept course :)