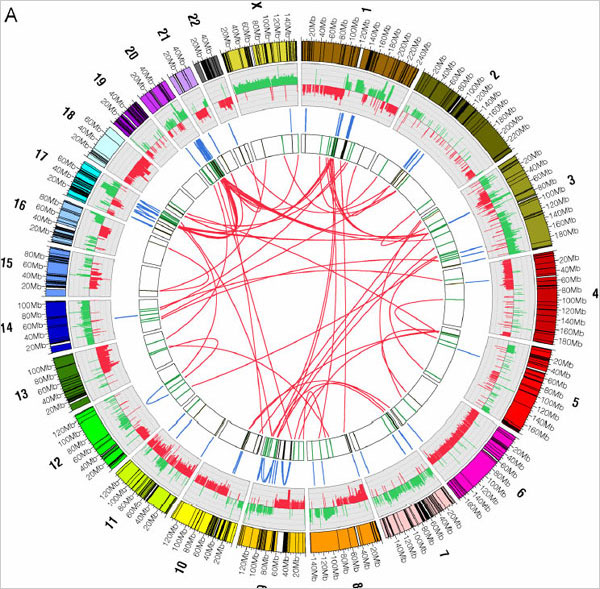
The thing about cancer cells is that they suck. Their DNA is all screwy. They’ve got chunks of DNA ripped out and reinserted into different places, which is just plain bad news for the cells in our body that play nice. You know, kind of like life. Researchers at the Baylor College of Medicine in Houston have compared the DNA of a certain type of breast cancer cell to a normal cell and mapped the differences (and similarities) with the above visualization.
The graphic summarizes their results. Round the outer ring are shown the 23 chromosomes of the human genome. The lines in blue, in the third ring, show internal rearrangements, in which a stretch of DNA has been moved from one site to another within the same chromosome. The red lines, in the bull’s eye, designate switches of DNA from one chromosome to another.
Some design would benefit the graphic so that your eyes don’t bounce around when you look at the technicolor genome but it’s interesting nevertheless.
Check out the Flare Visualization Toolkit or Circos if you’re interested in implementing a similar visualization with the above network technique.
[Thanks, Robert]

 Philip from





 I thought this was a joke when I first read it, but scientists from Japan’s ATR Computational Neuroscience Laboratories have developed software that can map brain activity to an image. Subjects were shown letters from the word neuron and images were reconstructed and displayed on a computer screen.
 One of the more painful parts of analysis or visualization is that you have to get the data in a proper format. Real data almost never comes how you want it.
 Visualize This: The FlowingData Guide to Design, Visualization, and Statistics (2nd Edition)