• Membership
  • Newsletter
  • Projects
  • Learning
  • About
  • Member Login
  • No axis labels

    December 13, 2010

    Topic

    Miscellaneous  /  axes, comic, xkcd

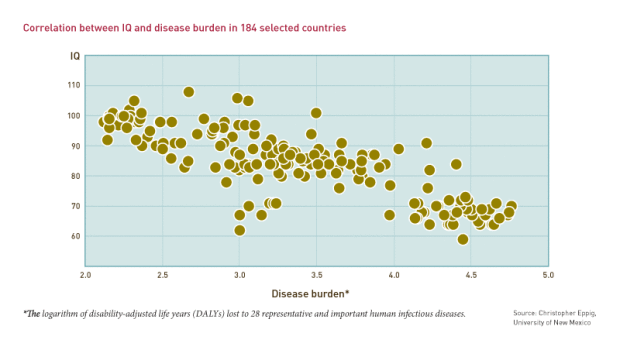
    xkcd geekdom for your slow Monday afternoon. Can you imagine being with someone who doesn’t label axes? Outrageous. [xkcd]

  • How the world searched in 2010

    December 13, 2010

    Topic

    Maps  /  Google, search

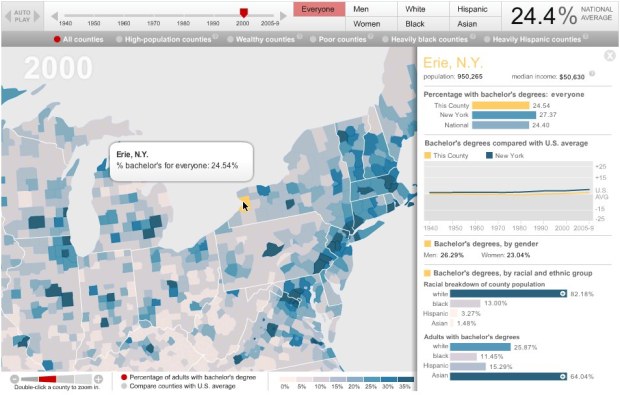
    Google recaps search trends for the year in Google Zeitgeist 2010, from the World Cup and the Olympics to the earthquake in Haiti and the BP oil spill. Above is relative search volumes around the world during the ash cloud in Iceland. You can browse the interactive map, or use the timeline to watch changes over significant events during the year.

    A video (below) also accompanies the interactive, showing how the physical world and digital are melding ever so nicely.
    Read More

  • Superheroes minimalized

    December 10, 2010

    Topic

    Data Art  /  heroes, illustration, minimalism

    Fabian Gonzalez goes minimalistic on superheroes. I like the Teenage Mutant Ninja Turtles. I used to pretend I was Donatello, the smart inventer one. Although in retrospect I’m probably more like Raphael, the moody and irritable one. Available in print and shirt form. [Society6 via Data Pointed]

  • College football coaches’ ballots

    December 9, 2010

    Topic

    Infographics  /  football, interactive, USA Today

    Brett Coffman and Juan Thomassie for USA Today have a look at how college coaches from the top 25 teams ranked other teams. You can look at it from two directions. You can look at the data by team, and see what all the other coaches ranked a team, along with rank by week. You can also see the data by individual coach to see his top 25 rankings. Albeit the latter view isn’t very useful unless you have a specific coach in mind. [USA Today | Thanks, Kevin]

  • Picturing social order

    December 9, 2010

    Topic

    Data Art

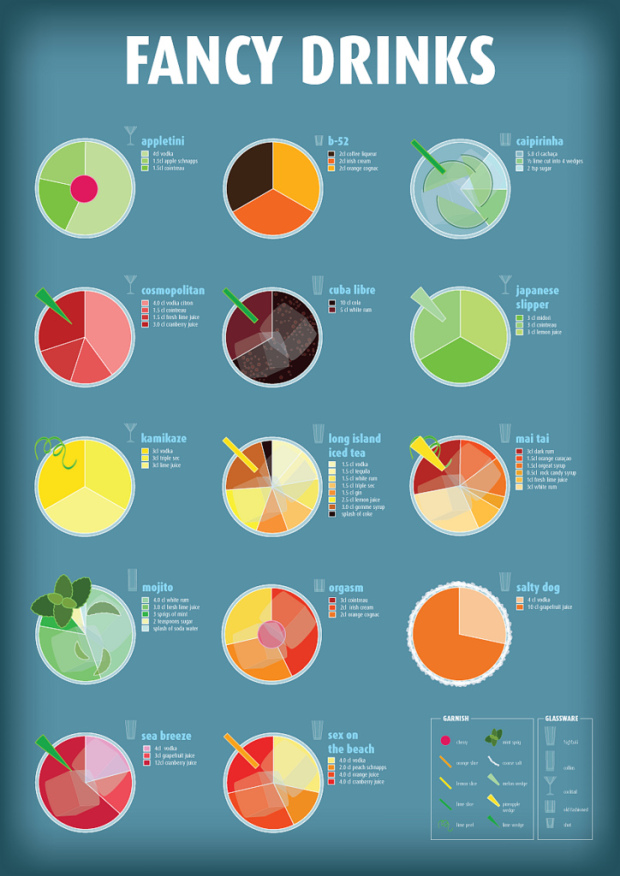
    Gareth Holt designed several charts and graphs for Rank: picturing the social order 1516-2009 at the Leeds Art Gallery. Above is a divided shirt that depicts the social classes. I guess you could call it a stacked shirt chart. There’s another that uses forks. I call it picture with forks. [Gareth Holt via We Love Datavis]

  • Data analysis is the future of journalism

    December 8, 2010

    Topic

    Statistics

    Tim Berners-Lee, credited with inventing the Web, says analyzing data is the future of journalism:

    “Journalists need to be data-savvy. It used to be that you would get stories by chatting to people in bars, and it still might be that you’ll do it that way some times.

    “But now it’s also going to be about poring over data and equipping yourself with the tools to analyse it and picking out what’s interesting. And keeping it in perspective, helping people out by really seeing where it all fits together, and what’s going on in the country.”

    The Guardian post focuses on current journalists learning new skills, but what we’re also going to see is a new type of person — computer scientists, statisticians, and interaction designers — become the storytellers.

  • Axes of peeing in public

    December 8, 2010

    Topic

    Infographics  /  axes, peeing, sociology

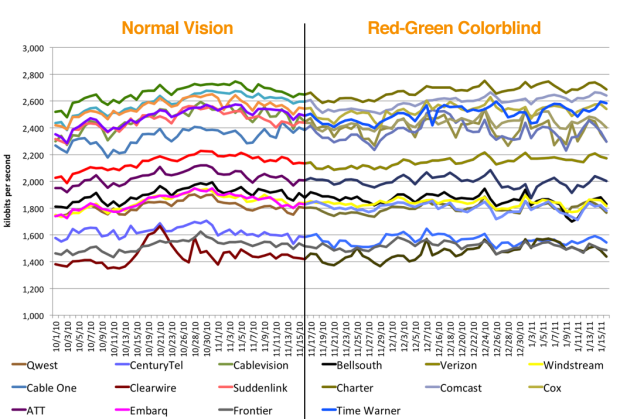
    You might think this is a joke, but this is serious business. From Laura Noren, a PhD candidate in sociology, the axes of public peeing:

    This was something I used to help me think through the two main axes that determine peeing behavior – biological and social control. Urination is a biological function that has been subjected to a great degree of social control. Unfortunately, urban design has not kept pace with the demand for clean, easily accessible public restrooms for humans. And there has been no attempt to create any kind of system to deal with canine urine. In most cities it is illegal for humans to pee in public but both legal and widely accepted for dogs to pee where ever they like (in New York, they cannot pee on the grass in parks).

    It seems the only solution is to let people go wherever they want, as the dogs do.

    [Graphic Sociology]

  • Similarities between PhD dissertations

    December 7, 2010

    Topic

    Network Visualization  /  bubbles, dissertations, Stanford

    Certain fields of study tend to cover many of the same topics. Many times, the two fields go hand-in-hand. Electrical engineering, for example, ties tightly with computer science. Same thing between education and sociology. Daniel Ramage and Jason Chuang of Stanford University explore these similarities through the language used in their school’s dissertations.
    Read More

  • The United States of Autocomplete

    December 6, 2010

    Topic

    Maps  /  autocomplete, Google, humor

    Very Small Array has some fun with Google’s autocomplete. Utah… Jazz. Kentucky… Fried Chicken. New York… Times.

    [Very Small Array via @mericson]

  • Relationships on the Bold and the Beautiful explained

    December 3, 2010

    Topic

    Infographics

    I don’t get soap operas. People get married, divorced, evil twins show up, babies are born, people are shot, and every now and then someone becomes the hostage of an ex-lover. It’s too complex for my simple mind. Luckily, here’s a video that explains all of the relationships in the Bold and the Beautiful, from 1987 up to present.
    Read More

  • Thank you, FlowingData sponsors

    December 3, 2010

    Topic

    Sponsors

    My many thanks to the FlowingData sponsors. They keep the lights on and help make this little blog of mine possible. Check ’em out. They help you understand your data.

    Tableau Software — Combines data exploration and visual analytics in an easy-to-use data analysis tool you can quickly master. It makes data analysis easy and fun. Customers are working 5 to 20 times faster using Tableau.

    InstantAtlas — Enables information analysts and researchers to create highly-interactive online reporting solutions that combine statistics and map data to improve data visualization, enhance communication, and engage people in more informed decision making.

    Want to sponsor FlowingData? Contact me at [email protected] for more details.

  • Jon Stewart explains Wikileaks’ Cablegate

    December 2, 2010

    Topic

    Data Sources, News

    You’ve probably already heard and read about Wikileaks’ Cablegate. If not, Andy Baio has a fine roundup with significant coverage and events to get you caught up quick. Alternatively, you can watch Jon Stewart and The Daily Show explain in the clip below (slightly NSFW, because it mentions a body part).
    Read More

  • Advanced visualization without programming – Impure

    December 2, 2010

    Topic

    Apps  /  bestiario, impure, vpl

    Programming can be tough in the beginning, which can make advanced visualization beyond the Excel spreadsheet hard to come by. Bestiario tries to make it easier with their most recent creation Impure:

    Impure is a visual programming language aimed to gather, process and visualize information. With impure is possible to obtain information from very different sources; from user owned data to diverse feeds in internet, including social media data, real time or historical financial information, images, news, search queries and many more.

    It’s not a plug-and-play application, but it’s not scripting in a text editor either. Think of it as somewhere in between that (hence the visual programming language). They’ve taken the logic behind code, and encapsulated them into modules or structures, and you can piece them together like a puzzle. The interface kind of reminds me of Yahoo Pipes.
    Read More

  • Amanda Cox on data graphics and stuff

    December 2, 2010

    Topic

    Visualization  /  Amanda Cox

    At New Media Days 2010, New York Times graphics editor Amanda Cox talks data graphics, finding a balance between storytelling and straight facts, and working at the graphics desk. Listen and learn in the video below (or you might want to bookmark since it’s about an hour long).
    Read More

  • Finding Global Agenda Councils who should work together

    December 1, 2010

    Topic

    Projects

    This past month, the World Economic Forum convened in Dubai to discuss issues on the global agenda. There are about 700 members who belong to 72 Global Agenda Councils. Before the forum, these members were asked to rank the top five other councils that his or her’s own council would benefit the most from interacting with. This data was made available for the WEF data visualization challenge.

    I made a weekend project out of it and got an honorable mention (darn). This is my entry.
    Read More

  • Awards from Recovery and Reinvestment Act

    December 1, 2010

    Topic

    Maps

    Between February 17, 2009 to September 30, 2010, 88,791 awards have been funded by the American Recovery and Reinvestment Act. This animated map shows where these awards have been distributed across the country month-to-month. Each “light” represents an award.
    Read More

  • The Joy of Stats with Hans Rosling

    November 30, 2010

    Topic

    Statistical Visualization  /  Hans Rosling

    The Joy of Stats, a one-hour documentary, hosted by none other than the charismatic Hans Rosling, explores the growing importance of statistics:

    [W]ithout statistics we are cast adrift on an ocean of confusion, but armed with stats we can take control of our lives, hold our rulers to account and see the world as it really is. What’s more, Hans concludes, we can now collect and analyse such huge quantities of data and at such speeds that scientific method itself seems to be changing.

    From the description, it sounds like they’ll touch on Crimespotting by Stamen, Google Translation, among other data-driven projects. Whatever they cover, it’s bound to be interesting with Rosling at the front.
    Read More

  • How do people use Firefox?

    November 30, 2010

    Topic

    Data Sources, News

    Mozilla Labs just released a bunch of anonymized browsing data for their open data visualization competition:

    This competition is based on Mozilla’s own open data program, Test Pilot. Test Pilot is a user research platform that collects structured user data through Firefox. All data is gathered through pre-defined Test Pilot studies, which aim to explore how people use their web browser and the Internet.

    There are two datasets in various formats. The first is browsing behavior from 27,000 users, including on/off private browsing that we saw a few months ago. The second dataset is from 160,000 users and is on how they actually use the Firefox interface.

    Additionally, both sets have survey answers to questions like “How long have you used Firefox?” which could make for some fun and interesting breakdowns.

    The deadline is December 17.

    [Mozilla Labs]

  • Build your LinkedIn career tree

    November 29, 2010

    Topic

    Network Visualization

    How did you get to where you are now in your work life? What about Barack Obama? Ashton Kutcher? Jon Stewart? In a collaboration between Newsweek and Bocoup, the Career Tree displays your LinkedIn profile (or a handful of celebrities) as a budding network.
    Read More

  • Statistics vs. Stories

    November 29, 2010

    Topic

    Statistics

    Professor of Mathematics at Temple University, John Allen Paulos describes the differences between statistics and stories:

    [T]here is a tension between stories and statistics, and one under-appreciated contrast between them is simply the mindset with which we approach them. In listening to stories we tend to suspend disbelief in order to be entertained, whereas in evaluating statistics we generally have an opposite inclination to suspend belief in order not to be beguiled.

    And he concludes:

    The focus of stories is on individual people rather than averages, on motives rather than movements, on point of view rather than the view from nowhere, context rather than raw data. Moreover, stories are open-ended and metaphorical rather than determinate and literal.

    Which way do we go when we start telling stories with data?

    [New York Times via @joandimicco]

  • Page 327 of 393
  • <
  • 1
  • ...
  • 324
  • 325
  • 326
  • 327
  • 328
  • 329
  • ...
  • 393
  • >

Analyze, visualize, and communicate data usefully, beyond the defaults.

Become a member →

Recently for Members

May 22, 2025
Conflicting points of view over the same data

May 15, 2025
Step Chart, Enhanced

May 8, 2025
When the data is not what it seems

May 1, 2025
Finding the Right Charts

April 24, 2025
Visualization Tools, Datasets, and Resources – April 2025 Roundup

Second Edition

Visualize This: The FlowingData Guide to Design, Visualization, and Statistics (2nd Edition)

Order: Amazon / Bookshop

Browse by Chart Type See All →

Variable Width Bar Chart Spiral Chart Pictogram Pyramid Chart Organogram Timeline Dot Map Area Chart Sankey Diagram Moving Bubbles

Browse By Topic

  • Visualization

    Seeing data

  • Maps

    Seeing geographic data

  • Infographics

    Explaining data

  • Networks

    Connecting data

  • Statistics

    Analyzing data

  • Software

    Working with data

  • Sources

    Getting data

  • Design

    Making data readable

Made by FlowingData

  • The Process

  • Data Underload

  • Chart Everything

  • Guides

  • Books

  • Shop

  • About
  • Contact
  • Newsletter
  • LinkedIn
  • Instagram
  • Bluesky
  • RSS
Copyright © 2007-Present FlowingData. All rights reserved.