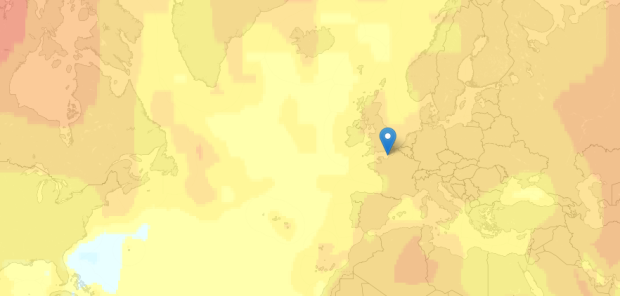
• Membership
  • Newsletter
  • Projects
  • Learning
  • About
  • Member Login
  • Sandy aftermath: Power outages and flooding →

    October 30, 2012

    Topic

    Maps  /  New York Times, Sandy, weather

    The New York Times provides a detailed look at the Sandy aftermath, across states and locally. With millions of people losing power in a short amount of time, the outages map and chart is the most dramatic.

    More than six million customers lost power Monday as Hurricane Sandy felled trees, downed power lines and flooded substations. The storm led to power failures in at least 17 states, including more than a million customers in Pennsylvania and New Jersey and about 660,000 in New York City.

  • Browse elections data back to 1976 with Electionary app

    October 30, 2012

    Topic

    Maps  /  elections, government, iPad

    Electionary, the new iPad app from TargetPoint Consulting, lets you browse national election data, from 1976 through 2008.

    Electionary is an election resource center that grants users access to over 30 years of county, state, and national election data. Electionary transforms election results into an easy to understand, interactive, and visual format. Users are able to see detailed election results and voter turnout percentages from across the country. Users can compare election results side-by-side and see how one county or state has changed over time or see how two counties or states are different.

    There were a few spots interaction-wise when it didn’t do what I was expecting, such as pinch or double tap to zoom, or when I switched years, the map would re-center on the selected state or county instead of staying where I had panned. But if you’re interested in historical elections data, Electionary ain’t bad, and I can only imagine there’ll be un update after elections night.

  • Hurricane tracker for Sandy

    October 29, 2012

    Topic

    Maps  /  hurricane

    The New York Times has an updated version of their hurricane tracker up with map, satellite, and radar views. Stay safe, east coasters.

    See also the live wind map by Martin Wattenberg and Fernanda Viegas, which has proven useful a couple of times this year.

  • Urine wheel to diagnose disease

    October 29, 2012

    Topic

    Infographics  /  urine

    Some days you take a whiff it’s easy: “Yep. Definitely had asparagus last night.” Other times though, it’s not so clear. This urine wheel by Ullrich Pinder from 1506, provides possible diagnoses based on color, smell, and taste. [via kottke]

  • A taxonomy of arse →

    October 26, 2012

    Topic

    Miscellaneous  /  flowchart, humor

    By designer Stephen Wildish, a taxonomy of arse. No comment necessary.

  • Insisting on beautiful maps

    October 25, 2012

    Topic

    Maps  /  book, NACIS

    In the Atlas of Design, published by the North American Cartographic Information Society, Timothy Wallace and Daniel Huffman argue for beautiful maps that are a joy to examine.

    Design and aesthetics matter, because form is not secondary to function; form is integral to function. A map cannot function if it remains unread. To truly engage map users requires that we present them with something worth looking at. Something that they will want to spend time studying. Something that acknowledges the human need for beauty. Something that causes the user to think about the map in terms beyond whether or not it simply “works.”

    Yep.

  • Lord of the Rings visualized

    October 24, 2012

    Topic

    Statistical Visualization  /  Lord of the Rings

    Driven by his love for Lord of the Rings, Emil Johansson explores the many facets of the world in charts and graphs. For example, the above chart is the declining lifespan of man.

    It is explicitly stated by Tolkien that the longevity of Men once granted to the Númenóreans decreased over the years. In Letter 156 Tolkien writes that “a good Númenórean died of free will when he felt it be the time to do so”. With the Shadow and the Downfall of Númenor this grace was taken away from them and they died involuntarily with a decreasing lifespan.

    The decreasing life span is seen clearly in the graph. The most dramatic change is shortly before the Downfall of Númenor. The rulers are shown in order. Their number should not be confused with how many generations from Elros Aragorn is since there were more than one line of rulers.

    There’s also a geographic map of where characters traveled, a family tree, a timeline, and even an Android app. I think Johansson might be a superfan. A hunch.

  • Stephen Colbert on the USA Today infographic logo

    October 23, 2012

    Topic

    Miscellaneous  /  humor, Stephen Colbert, USA Today

    USA Today launched a redesigned logo last month. It’s a circle that reflects the day’s news in each section. Stephen Colbert reports.

    [via @albertocairo]

  • Data on decades of Boy Scout expulsions released

    October 22, 2012

    Topic

    Data Sources  /  Boy Scouts, Los Angeles Times

    The Los Angeles Times released nearly 5,000 records of allegations from the Boy Scouts of America as a browseable map and searchable list. You can also download the data.

    This data­base con­tains in­form­a­tion on about 5,000 men and a hand­ful of wo­men who were ex­pelled from the Boy Scouts of Amer­ica between 1947 and Janu­ary 2005 on sus­pi­cion of sexu­al ab­use. The dots on the map in­dic­ate the loc­a­tion of troops con­nec­ted in some way to the ac­cused. The timeline be­low shows the volume of cases opened by year; however, an un­known num­ber of files were purged by the Scouts pri­or to the early 1990s

    The interactive map helps you narrow down by city, but it’s kind of hard to see cases on a country-wide perspective. Here’s a quick look.

    The worst part is that a lot of the cases went unreported.

  • xkcd-style charts in R, JavaScript, and Python

    October 19, 2012

    Topic

    Software  /  JavaScript, Python, R, xkcd

    The ports and packages to make your charts look like they came from the web comic xkcd are coming out in rapid fashion. Dan Foreman-Mackey stylized charts in JavaScript using D3, Mark Bulling did the same in R (dead/spam link), Emilio Torres Manzanera made an xkcd package, and Jake Vanderplas described how he did in Python. Still waiting for a Gangnam theme.

  • Page 256 of 392
  • <
  • 1
  • ...
  • 253
  • 254
  • 255
  • 256
  • 257
  • 258
  • ...
  • 392
  • >

Analyze, visualize, and communicate data usefully, beyond the defaults.

Become a member →

Recently for Members

May 15, 2025
Step Chart, Enhanced

May 8, 2025
When the data is not what it seems

May 1, 2025
Finding the Right Charts

April 24, 2025
Visualization Tools, Datasets, and Resources – April 2025 Roundup

April 17, 2025
Breaking Out of Chart Software Defaults

Get the Book

Visualize This: The FlowingData Guide to Design, Visualization, and Statistics

Available now.

Order: Amazon / Bookshop

Browse by Chart Type See All →

Connected Scatter Plot Bubble Chart Area Chart Histogram Choropleth Map Calendar Surface Plot Dot Plot Barcode Chart Box Plot

Browse By Topic

  • Visualization

    Seeing data

  • Maps

    Seeing geographic data

  • Infographics

    Explaining data

  • Networks

    Connecting data

  • Statistics

    Analyzing data

  • Software

    Working with data

  • Sources

    Getting data

  • Design

    Making data readable

Made by FlowingData

  • The Process

  • Data Underload

  • Chart Everything

  • Guides

  • Books

  • Shop

  • About
  • Contact
  • Newsletter
  • LinkedIn
  • Instagram
  • Bluesky
  • RSS
Copyright © 2007-Present FlowingData. All rights reserved.