After seeing this map on The Guardian, I was curious about what other data was available from the National Highway Traffic Safety Administration. It turns out there’s a lot and it’s relatively easy to access via FTP. What’s most surprising is that it’s detailed and fairly complete, with columns for weather, number of people involved, date and time of accidents, and a lot more.
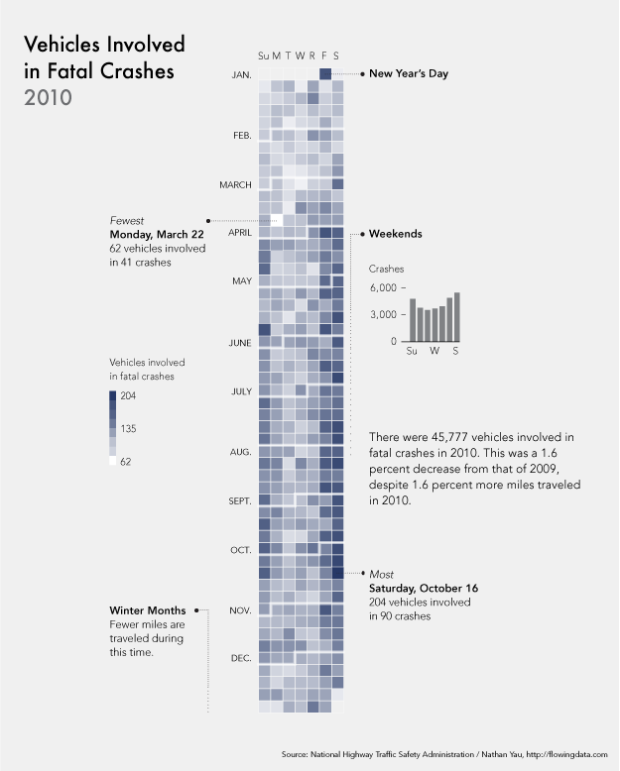
The above shows vehicles involved in fatal crashes in 2010 (which is different from number of crashes or number of fatalities). This data was just released last month, at the end of 2011 oddly enough. It’s a calendar view with months stacked on top of one another and darker days indicate more vehicles involved.
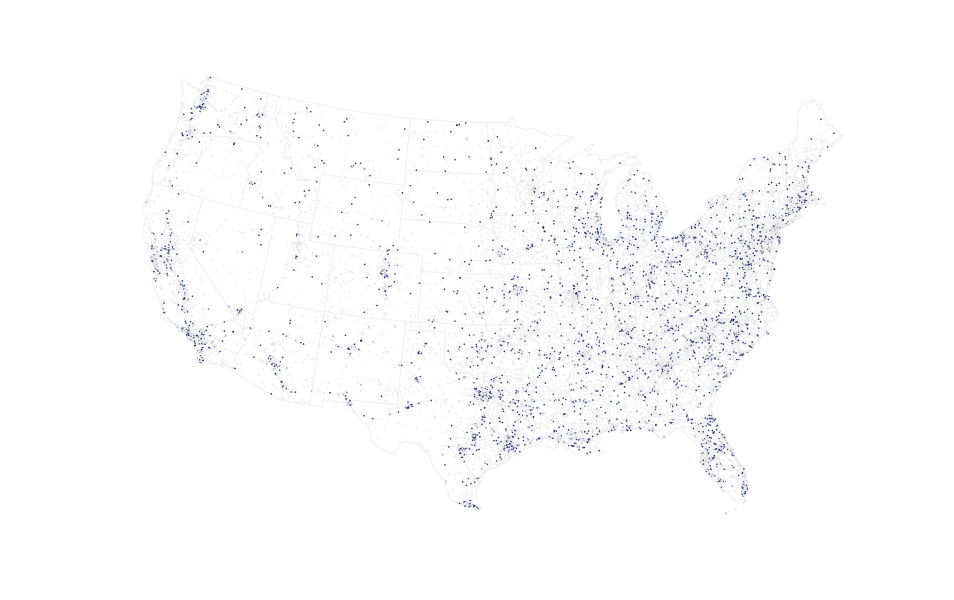
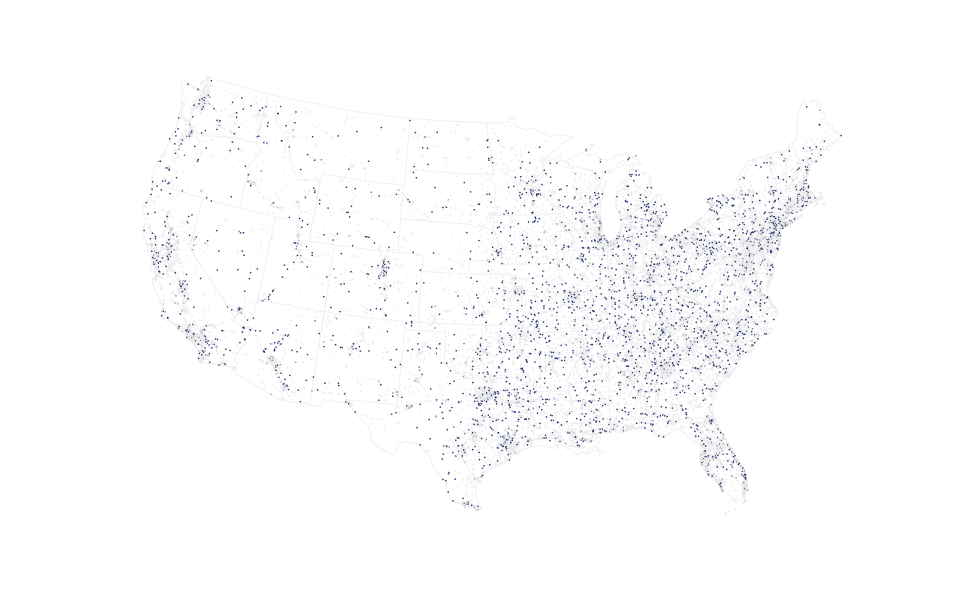
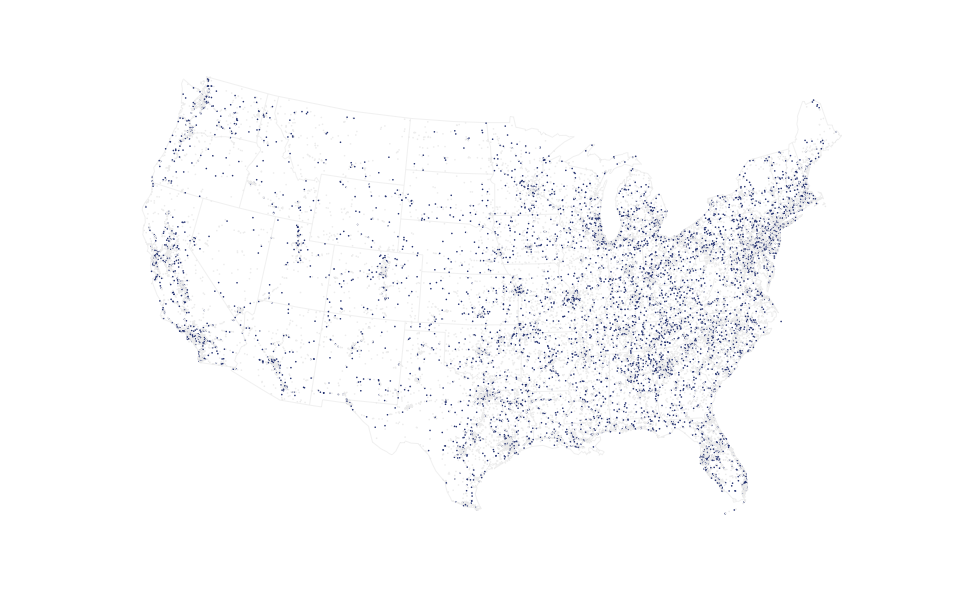
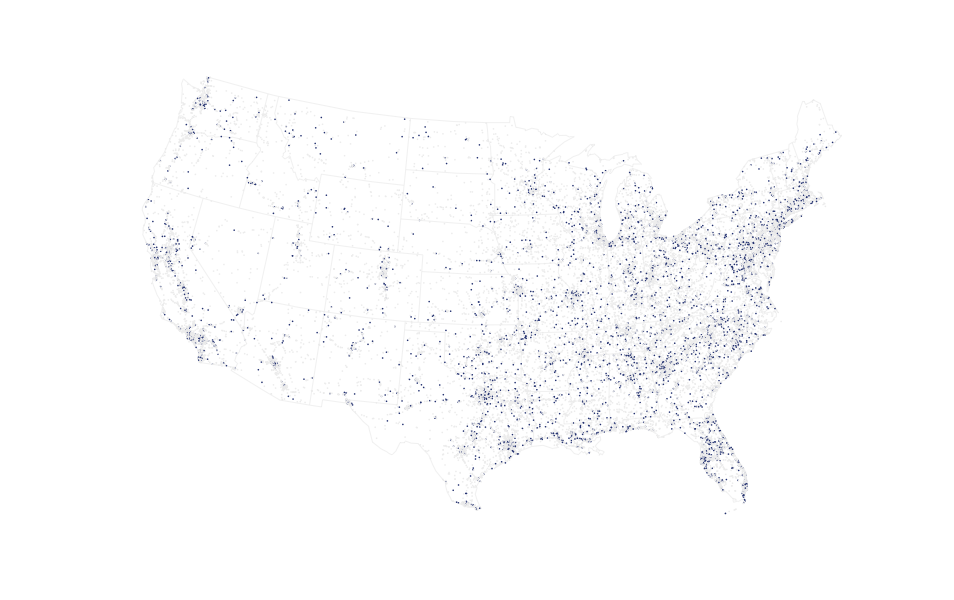
Nearly every single data point also has location attached to it, so I tried some mapping, but they look like population density more or less. Here’s one that shows crashes that occurred on local roads (orange) and those on freeways, highways, etc (blue). Road patterns start to come out for the major interstates.

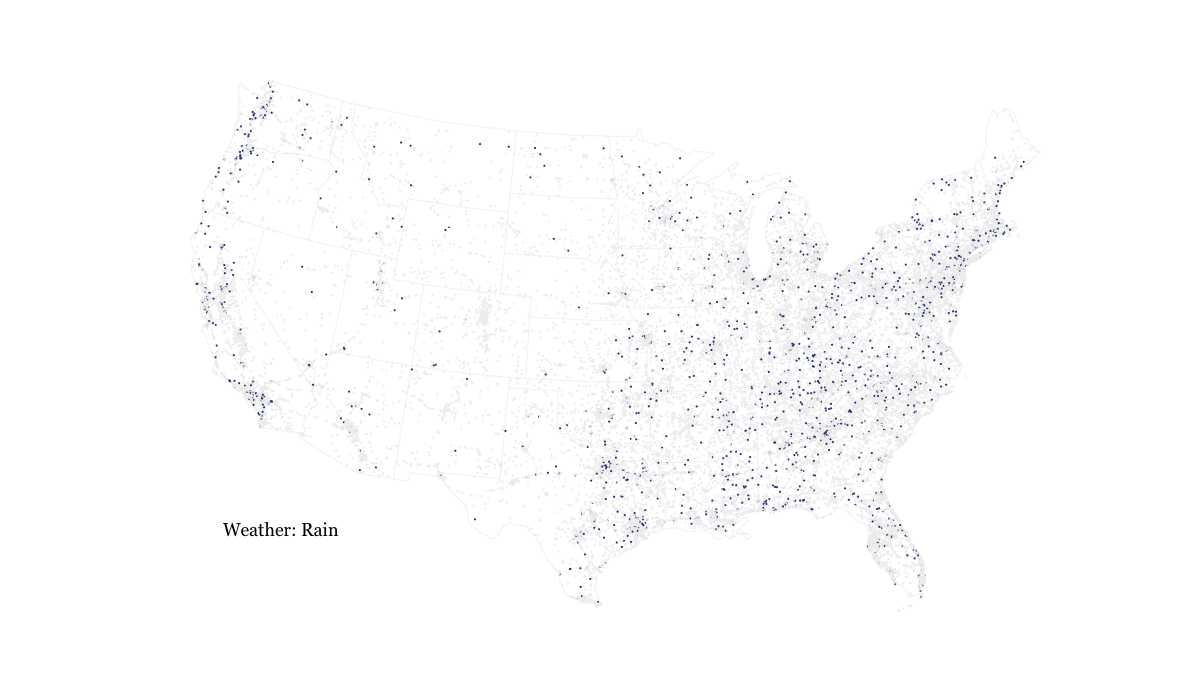
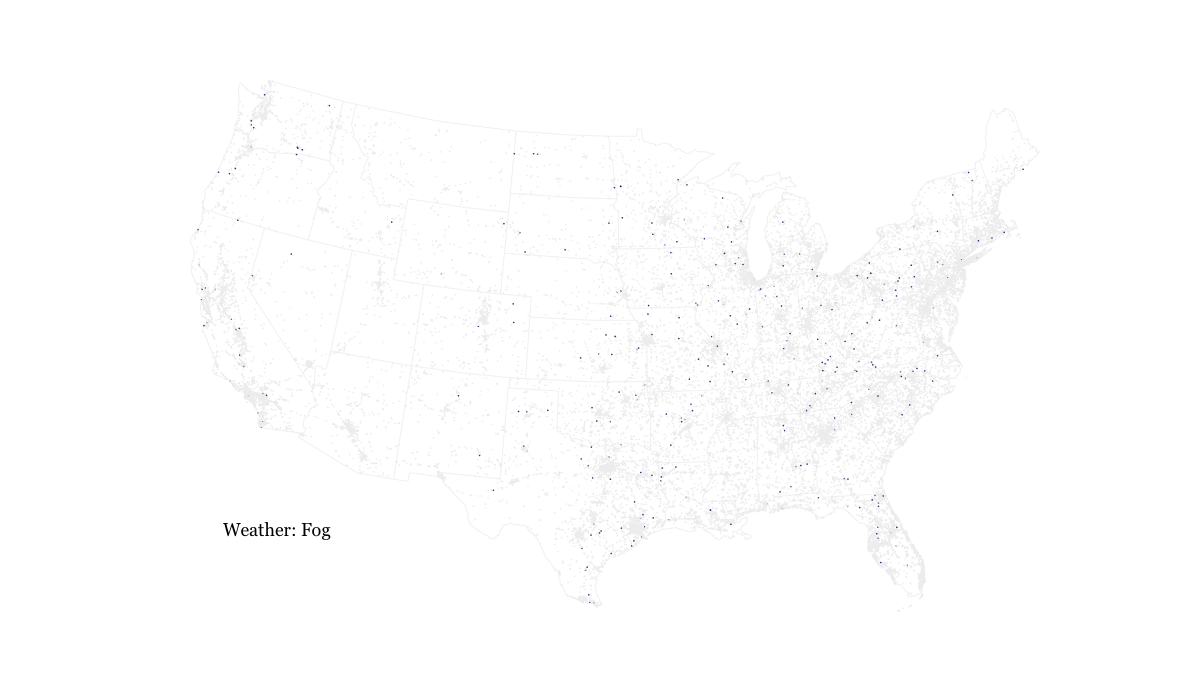
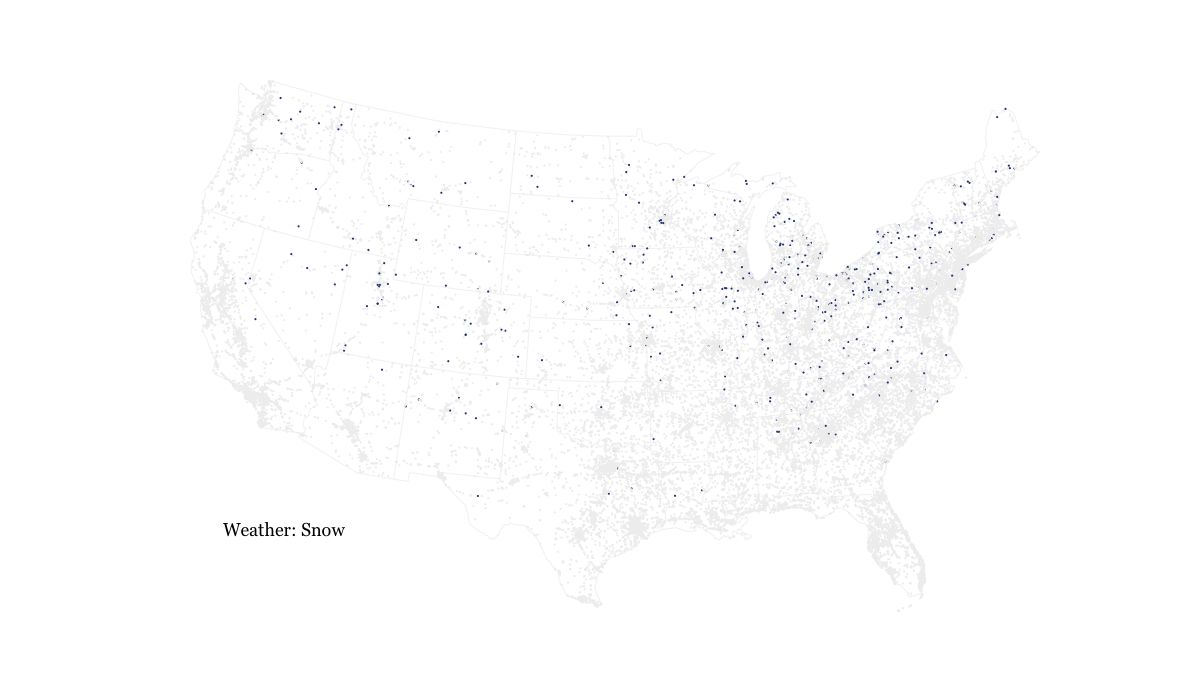
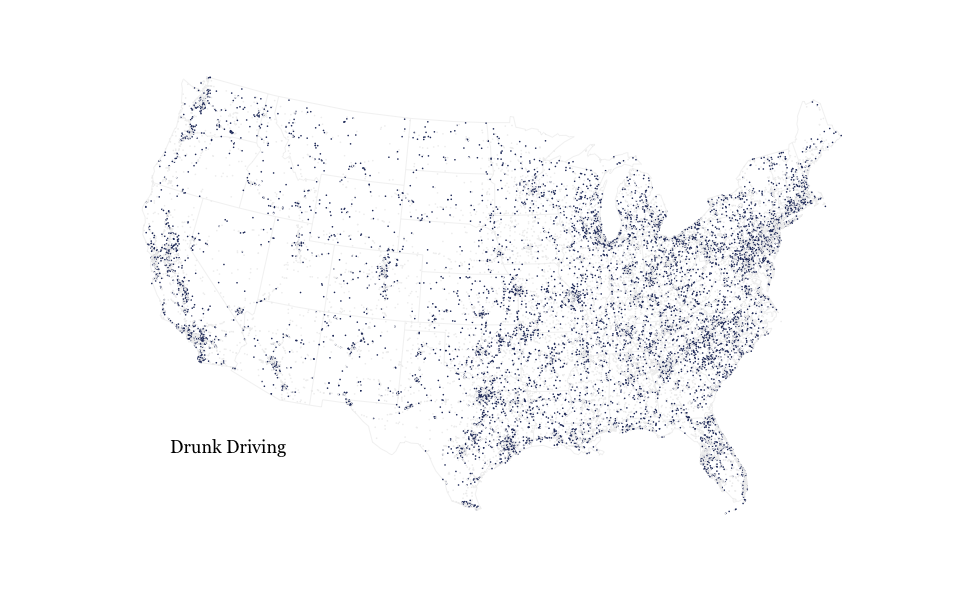
I also mapped by weather (rain, fog, snow), time of day (midnight to 4am, 4-8, 8-noon, noon to 4, 4 to 8, and 8 to midnight), and crashes due to drunk driving but it wasn’t as interesting as the day-by-day.
If you’re a teacher looking for data to use with an assignment or just want to practice, this is a good set, despite the somber topic. You can find the data here, and there’s an FTP link in the footer of the page to download more detailed data. You’ll also need this guide [pdf] that defines all the variables.


 Visualize This: The FlowingData Guide to Design, Visualization, and Statistics (2nd Edition)
The numbers on the color scale seem incorrect. Going from 62 to 44 to 149
Fixed, thanks
Since accidents seem to cluster on Friday, Saturday, and Sunday, clustering those together on the right side of the graphic and starting the week on Monday (on the left) might make it easier to discern that pattern.
What’s the best way to display cyclical data? Perhaps a radar chart of each week with each day of the week as a spoke? If Nathan cuts the week at Tuesday, it’s going to produce a different look.
I would somehow try to duplicate the data a bit and do something like M T W T F S S M T so you could see the patterns at any point in the week (so the end of the January line would actually contain some data for February). As others have said, the important pattern is around the weekends, but it’s interesting to see the leadup to the weekend (ie Thursday vs Friday vs Saturday) but also on the other side, (Sat vs Sun vs Mon). So really showing the range of Thur – Mon is the most interesting timespan. If you didn’t want to duplicate data I’d probably do a single week as Wednesday – Tuesday, which puts Friday, Saturday, and Sunday smack in the middle of the chart.
Some feedback:
1) I get the point about winter months, but these months, at least in the north US, also tend to feature more dangerous driving conditions. What do you think of the tradeoff there?
2) Weekends. I agree with Clay — putting F, S, Su all on the right side makes more sense. I think you’re trying to show that weekends are higher with that little bar chart on the right. I don’t find that the dotted line leading up to the bullet “Weekends” is helpful. The other dotted lines are near their area (winter) or point to specific days. I kept trying to figure out why “Weekends” was highlighting Apr-Aug.
Other than those, very neat graphic! If you’re interested in another transportation related one, you might look into the data available from the National Transit Database. I used it to answer this question on skeptics.stackexchange about whether or not public transportation was more fuel efficient than cars. You would do a supremely better job…
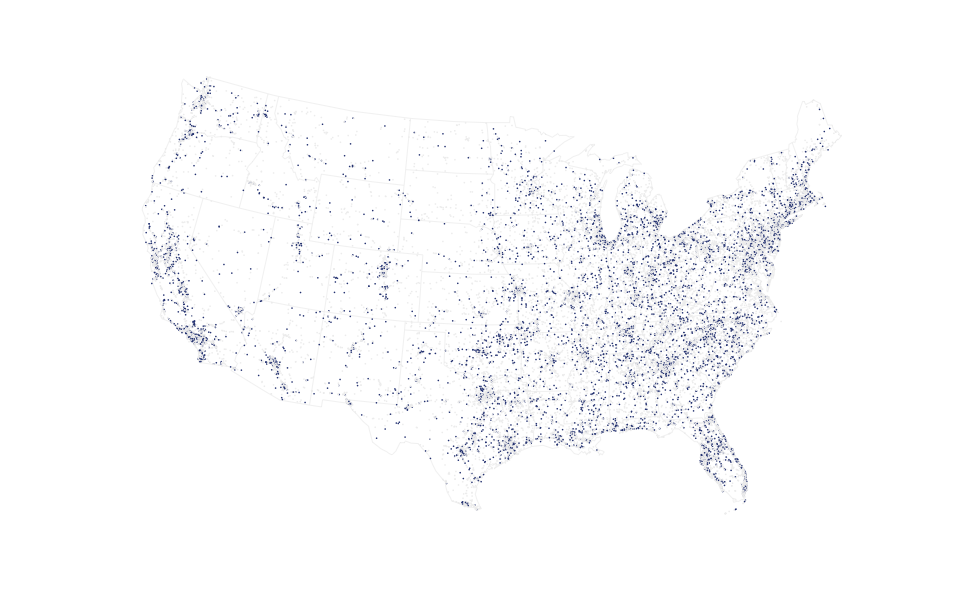
1. I had that in mind for sure, but I wanted to focus on the national counts. But here’s a map of the crashes that occurred while it was snowing:
https://flowingdata.com/wp-content/uploads/2012/01/snow.png
2. I could’ve gone either way with the shift. For this, I decided to keep with the traditional calendar, and I think people are familiar enough with the format to notice the pit in the middle and the peaks on the ends.
Wisconsin just had a terrible December for fatalities, precisely because the weather was so mild. Our worst months (as with the nation as a whole) are the summer months, when everyone is out driving.
Would be interesting to view this data in relationship with some weather data.
(Drinking) holidays as well.
The ” most” line is pointing to the wrong date.
I was wondering why the date changed from this morning. The previous date was the day before my birthday, so I felt kind of bad that everyone must have been partying on that date.
Yeah, right date marked, wrong date typed. Thanks for the complimentary copy editing.
It would also be interesting to see the accidents as a percentage of estimated cars on the road for any given day (does such data exist). Then, you can see which days you have a higher probability of being involved in an accident.
Awesome graph and really interesting data set. One slight copy edit: NHTSA is National Highway Traffic Safety –> Administration <–
Great graph Nathan, very nice. I recently bought your book and started following your blog so maybe the answer to this Q is obvious; but I have missed it so here goes:
Have you previously written about and given R code (or similar) for producing such yearly and/or weekly “heatmaps” (geom_tile in ggplot2?) ?
@Robert – I did this in R and then brought it into Illustrator for final touchups. A tutorial is in the queue.
This should be helpful:
http://blog.revolutionanalytics.com/2009/11/charting-time-series-as-calendar-heat-maps-in-r.html
It’s not what I used, but it does just about the same thing.
Have you created a tutorial yet for this? I’d love a link if you have one. THX!
@datayoda – Calendar heatmap: https://flowingdata.com/2012/03/15/calendar-heatmaps-to-visualize-time-series-data/
Good looking graphic.
I do some similar color coding with electric hourly interval data to show diurnal and seasonal variations in electric consumption for projects. I’m working with a much more granular set of data 8760 data points instead of 365, and a different layout: 24 hours on the horizontal and 365 days on the vertical axis, as opposed to this one’s 7 days on the horizontal and 52 weeks on the vertical.
I just have Excel do the color-coding with the built-in Conditional Formating tool based on a 3-Color scale. Zooming way out you get a pretty good sense of variation in the data points.
I’m curious what software you used for this graphic – I’m assuming it was Illustrator or something similar.
I can recreate the effect more or less in Excel (making the cell contents invisible to eliminate the visual distraction and adding white borders to each cell to demarcate the cells, bit its not nearly as clean. Part of it is the granularity – I end up with more rows&columns because of the nature of the data I’m working with – but the look and feel still isn’t quite as polished as what you have here.
Seeing Robert’s comment above, I guess you might have done it in R too…
I work in Wisconsin’s Highway Safety Office and deal with these kinds of numbers every day. But I’ve never bothered to put them into a visually appealing format. Thanks for doing it for me; your graphic now graces my cubicle wall.
honored :)
You say that geographical distribution is similar to population distribution – what happens if you convert it to accidents per capita?
Agreed, I would love to see this normalized by population. This problem happens a lot, where mapping some variable just shows you population distribution. Of course the correction becomes tricky depending on your unit of analysis, or if you convert to some kind of density raster… could be an interesting subject for a future post.
I would like to know about the texting and driving stats compared to other reasons. Is there something like this here too?
I would suggest that the “day” should run from noon to noon (Friday is Friday noon to Saturday noon). Though the reasons were different, this is how astronomers (and mariners) used to reckon days (up to 1925). And I’ve seen calendars that start with Monday–I imagine most people could handle this. Actually, I’d start with Tuesday, to bring out the 3-day weekends.
I think it would be interesting to separate the drunk driving related fatal accidents into an additional chart placed side-by-side with the non-drunken accidents. It would be interesting to see if the weekend/holiday related spikes are attributed solely to alcohol or if there is a general lack of vigilance/attention on weekends/holidays.
soooo pretty !!!!!
the code would be highly useful, at least up to the Illustrator part.
Thanks for such nice examples. The FTP link for the data does not seem to be working
Yes, the FTP link no longer works. I think the new link is this one: http://www.nhtsa.gov/FARS
interesting graphic. i used to work on motor insurance in the UK. over here, we find that worsening driving conditions mean more accidents in the winter, although our winters are nothing like as severe, so the amount of traffic on the roads remains. the other point is that fatalities remain pretty rare. in insurance we tend to look at number of accidents and then fatalities per accident as a) accidents are a better measure of risk, and b) fatailities per accident have less seasonality. in terms of drinking and the holidays, in the uk this is a relatively small issue. not sure about things stateside.
I’ve worked with these data sets a fair bit – the biggest struggle I’ve always had – as you’ve implied – is that normalizing the data to regions, vehicle type, day of week, etc. is just so difficult. I got some way in discussing getting normalizing data from the DOT group that puts those strips on the road to measure traffic per road, and more than that: because they have two strips can give you the rough vehicle type.
The link http://www-fars.nhtsa.dot.gov/Main/reportslinks.aspx doesn’t work
It would have more meaning to show how many people were killed rather than how many vehicles were involved.