NASA mapped the annual cycle of all plant life on the planet in this animated map.
Satellite instruments reveal the yearly cycle of plant life on the land and in the water. On land, the images represent the density of plant growth, while in the oceans they show the chlorophyll concentration from tiny, plant-like organisms called phytoplankton. From December to February, during the northern hemisphere winter, plant life in the higher latitudes is minimal and receives little sunlight.
See also John Nelson’s breathing earth that used satellite imagery.
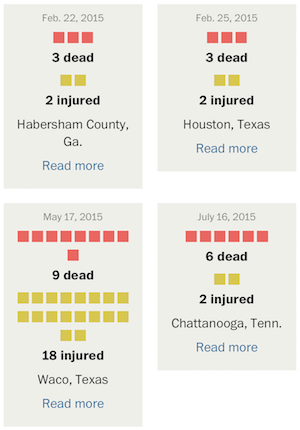 With recent events, you’ve likely seen the articles and graphics that get into the number of mass shootings this year and further into the past. You might have noticed that the numbers seem to vary depending on where you look, and the difference likely stems from how “mass shooting” is defined by the author.


 Plotly, a service that lets you make interactive charts online,
 Visualize This: The FlowingData Guide to Design, Visualization, and Statistics (2nd Edition)