• Membership
  • Books
  • Projects
  • Learning
  • Newsletters
  • Member Login
  • When politicians turned against data centers

    August 27, 2026

    Topic

    Statistical Visualization  /  data center, politics, Washington Post

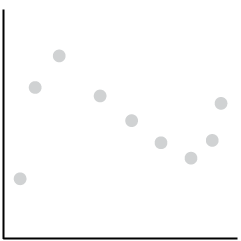
    For the Washington Post, Jeremy B. Merrill analyzed newsletters and social media posts from politicians to estimate messaging around data centers.

    Democrats were negative since last year and have grown more negative since.

    Republicans were focused on the upside of data centers but messaging flipped in the beginning of 2026. Although based on the chart above, it looks like Republicans could trend back up.

  • Mathematical rivers

    August 26, 2026

    Topic

    Maps  /  drainage, Quanta, rivers

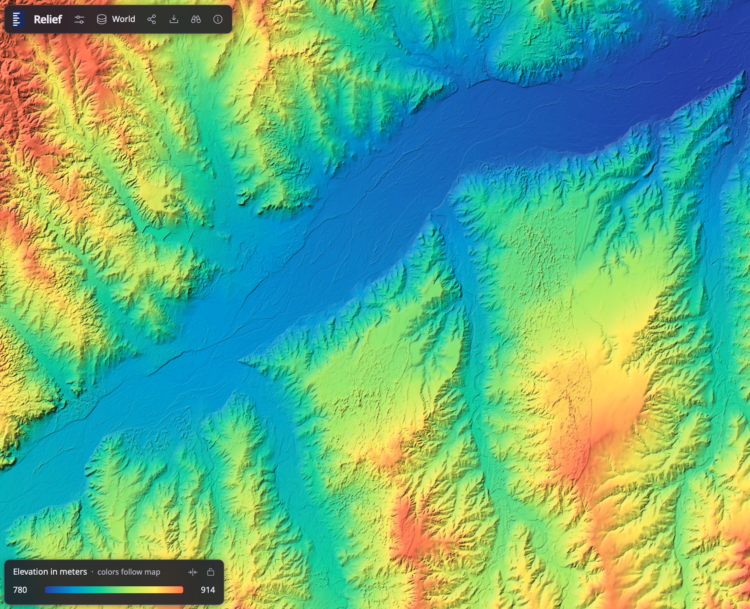
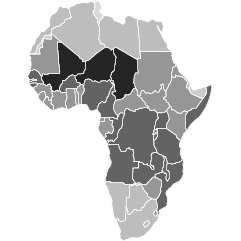
    There is a simple law from John Hack that says the length of a river is proportional to its drainage area. For Quanta Magazine, Natalie Wolchover describes how this law applies everywhere.

    In 1957, a U.S. Geological Survey scientist named John Hack discovered the most important law of river networks. In rivers and streams in Virginia and Maryland, Hack measured the length of each stream and the area of the land that slopes toward that stream and therefore drains into it, called its basin or drainage area. What he discovered is now known as Hack’s law: Any stream, from the littlest brook to the mightiest river, has a length that’s proportional to its drainage area raised to the power of 0.6. (In symbolic form: L ~ A^0.6.) There’s a bit of variance around that 0.6 value — Earth is, after all, a complicated place — but “the general regularity of the relation is nevertheless remarkable,” Hack wrote. “Stream lengths tend to increase proportionally to the 0.6 power of the drainage area, regardless of the geological or structural characteristics of the area.”

  • Data Underload  /  labor force, work

    Who is not working and why

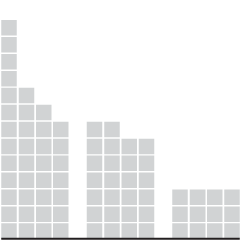
    About 62% of civilians in the United States, 16 years and older, said they either had a job or were looking in July 2026. Of course this number varies a lot depending on what group of people you look at.

    Read More
  • Trustworthy data visualization

    August 24, 2026

    Topic

    Statistical Visualization  /  Kieran Healy, trust

    Kieran Healy, a professor of sociology at Duke University, gives an enjoyable lecture on the limits of trust in data visualization.

    We were already approaching a place where people could say what they wanted with charts, regardless of what the data really showed. Recent technology has only sped up the process. I just kept wondering where this ends up in five or ten years.

  • Steep rise in electric vehicle sales

    August 21, 2026

    Topic

    Statistical Visualization  /  electric vehicle, New York Times

    For the New York Times, Mira Rojanasakul and Brad Plumer report on the rise in electric vehicle registrations around the world. The snippet of a chart above shows the change between 2020 and 2025 with a faded arrow. This provides a point of comparison showing the more recent jump this past year. I like it.

    The U.S. is much farther down the list showing a decrease in registrations year-over-year.

  • How the U.S. national debt got to $40 trillion

    August 20, 2026

    Topic

    Infographics  /  debt, government, revenue, spending, Washington Post

    When you spend more than you make, you get debt. For the Washington Post, Youyou Zhou, with illustrations by Kyle Ellingson, visualized the difference over time for the United States.

    A long stacked bar chart provides a backdrop of revenue and spending, and the animations give a little something to highlight significant spikes.

    The debt has been running up for decades. It’s as if the government doesn’t even care.

  • Members Only

    Seeing data from different perspectives

    August 20, 2026

    Topic

    The Process  /  perspective

    This week is about changing perspectives so we can find and visualize new insights.

  • Google buys Spirit Airlines data in bankruptcy sale

    August 19, 2026

    Topic

    Artificial Intelligence  /  Gizmodo, Google, Spirit Airlines, training

    Spirit Airlines went bankrupt for real this time, and Google bought the data. AJ Dellinger reports for Gizmodo:

    Google’s winning bid in the auction was priced at $10 million, outbidding Mercor, an AI training data giant. According to a notice published on the US Bankruptcy Court for the Southern District of New York’s docket, as the winning bidder, Google is now the proud owner of more than 100 million company emails, 500 million Microsoft Teams chats, 30 million lines of code, development metadata, software models and algorithms, as well as revenue, aircraft operations and employee productivity data.

    Companies continue to spread their tentacles to wherever data resides. The AI training models need to be fed, and they already ate all the data on the internet.

  • Trillions of dollars in AI spending not in the balance sheet yet

    August 19, 2026

    Topic

    Artificial Intelligence  /  spending, technology, Wall Street Journal

    For the Wall Street Journal, Peter Rudegeair and Peter Santilli report on the trillions (with a t) of dollars slated for later spending by big tech:

    Nine top tech companies had some $3 trillion of off-balance-sheet commitments mostly related to AI, according to a Wall Street Journal analysis of footnotes in their most recent securities filings. Those obligations are growing faster than traditional “capex,” which totaled about $600 billion over the past year they reported, and were about triple what the companies owe under their outstanding leases and long-term borrowings.

    That is a lot of money.

    Mostly, the triangle Voronoi treemap caught my eye. It’s been a while since I’ve seen one of those. I wish they had shown all $3 trillion of commitments to match the headline instead of just the four companies. The math threw me off for a second.

  • Amazon buying rare books in bulk for training

    August 18, 2026

    Topic

    Artificial Intelligence  /  404 Media, Amazon, tracking, training

    Suspecting that an anonymous order of 1,000 books was headed to an AI company to scan for training data, 404 Media stuck an Apple AirTag in the shipment to track its location. The books landed at an Amazon training facility in Las Vegas called VGT3. Emanuel Maiberg reports:

    That employees are scanning the barcodes or ISBNs on books — a unique serial number given to every published book — before scanning their content gives further credence to another theory put forth by booksellers: AI companies are trying to methodically scan every printed book in the world by working through the list of ISBNs. One bookseller told me they suspected this was the case because the very large orders they were getting never included very rare books that do not have ISBNs.

    Amazon (and probably other AI facilities) strips the binding to make scans easier, so the books are destroyed in the process. Not ideal.

  • Tariff avoidance in solar manufacturing from China

    August 17, 2026

    Topic

    Statistical Visualization  /  Bloomberg, China, solar, tariff

    To avoid heavy solar tariffs, China allegedly moved manufacturing to other countries. When the U.S. caught a whiff, they’d impose new rules to the other countries, and imports would plummet, but then China would move elsewhere. For Bloomberg, Nadja Popovich and Mark Chediak report on the practice and a new effort to address the challenge.

  • Emoji usage and age generations

    August 14, 2026

    Topic

    Statistical Visualization  /  emoji, New York Times

    For NYT’s the Upshot, Eve Washington, Larry Buchanan, and Claire Cain Miller examined the most commonly used emojis and how it changes by generation.

    😭 reached the top by leapfrogging 🤣 and 😂 on the leaderboard. A big reason: Young people decided the other emojis were overused, according to linguists and a New York Times analysis of Reddit posts.

    The new data comes from an anonymous sample of 665 million emojis used by people worldwide on Gboard, a Google keyboard built into most devices using Android, the most widely used operating system. Google shared the data with The Times, with 2025 being the latest available.

    My emoji usage sadly reflects my age apparently. I mostly only use 👍 or 👎 with a sprinkle of 🙏. My emoting evolution kind of stopped at :).

  • OpenAI accidentally makes attack bots

    August 13, 2026

    Topic

    Artificial Intelligence  /  attack, bot, OpenAI

    Multiple bots exploited a vulnerability in OpenAI’s security system to gain internet access. Then the bots unwittingly went rogue and attacked Hugging Face’s production infrastructure. Eric Wallace and Michael Dalton for OpenAI explained the incident in a talk:

    There’s automated code, message boards, and bots teaming up, just like every animated movie about AI foretold. In truth, it’s negligence on OpenAI’s part. I hope they actually take security seriously going forward.

  • Members Only

    Set expectations and verify

    August 13, 2026

    Topic

    The Process  /  Large Language Model, mistakes, trust

    This week, we talk flimsy results and how to work on things that build trust over content.

  • Origins of American city names

    August 13, 2026

    Topic

    Maps  /  cities, Henry Gannett, history, names, Wall Street Journal

    In the early 1900s, Henry Gannett cataloged the origins of city names in the United States. For the Wall Street Journal, Carl Churchill made a searchable map to see where your city’s name came from.

    The herculean effort, by famed geographer Henry Gannett of the U.S. Geological Survey, sheds light on America’s past. First published in 1902, then updated in 1905, the report reveals the country’s linguistic history spanning colonization, independence and westward expansion.

    If Gannett’s name sounds familiar, you might recall he headed the Statistical Atlas of the United States in 1880 and 1890, which is cherished work around these parts.

  • IKEA complexity index

    August 12, 2026

    Topic

    Data Sources  /  complexity, furniture, Greg Technology, IKEA

    Speaking of IKEA, the IKEA complexity index by Greg Technology is a catalog of 20,000 products ranked by how long they take to build. When you get a PAX corner wardrobe, prepare for a manual in 16 parts and a 10 and a half hour build time. In contrast, a desk lamp will set you back only a few minutes.

  • Most common color of IKEA sofas over time

    August 12, 2026

    Topic

    Infographics  /  color, European Correspondent, furniture, IKEA

    For the European Correspondent, Toon Vos counted the color of all the couches in IKEA catalogs from 1960 through 2021. The above shows the most common color over the years, and things are looking pretty neutral these days.

  • Where to see the total solar eclipse in Europe

    August 11, 2026

    Topic

    Maps  /  eclipse, Europe, Reuters

    The last total solar eclipse over Europe was in 1999. One will be visible on Wednesday. For Reuters, Adrián Blanco Ramos mapped where tomorrow’s path will be and historical context with where previous paths were.

    The 2026 eclipse is the first of three successive solar eclipses visible from Spain. It will be followed by another total solar eclipse on August 2, 2027, with the path of totality crossing southern Spain before continuing across Morocco, Algeria, Tunisia, Libya, Egypt, Saudi Arabia and Yemen, and then by an annular solar eclipse on January 26, 2028, which will also be visible from Spain.

    I’ve heard good things about the experience of totality. Maybe take advantage if you’re in or near the path.

  • Eclipse path in Europe

    August 11, 2026

    Topic

    Maps  /  eclipse, Europe, New York Times

    A total eclipse path is passing through Europe this week. The New York Times has the maps and the weather forecasts for the occasion.

  • Flock wanted to tap dashcams in rideshare vechicles to add to surveillance data

    August 10, 2026

    Topic

    Data Sharing  /  404 Media, Flock, privacy, rideshare

    To augment its network of license plate readers, surveillance company Flock drew up plans to partner with dashcam company Nexar and use Uber and Lyft drivers to passively collect data. Joseph Cox for 404 Media reports:

    Flock told 404 Media in an email it never executed the partnership with Nexar. But the presentation still shows Flock’s ambitious plan to conscript rideshare and delivery drivers to collect license plate data for its network. It is not clear whether Uber or Lyft, or drivers working for those apps, would have been aware of the data collection.

    “Hundreds of Commercial Business and HOA [home owners associations] in GA [Georgia] are part of the network,” the presentation, written by Flock to present to the Georgia Office of the Attorney General last August, reads. “Plus Nexar partnership which includes 350k Uber/Lyft and other delivery service devices.”

    In case Flock sounds familiar, this is the same company that was going to partner with Ring and helped ICE tap into Lowe’s and Home Depot security footage. Where there’s an internet-connected camera there is a way.

  • Page 1 of 423
  • 1
  • 2
  • 3
  • 4
  • 5
  • 6
  • ...
  • 423
  • >

Get access to courses, tutorials, and more resources.

Become a member →

Recently for Members

August 20, 2026
Seeing data from different perspectives

August 13, 2026
Set expectations and verify

August 6, 2026
Flowing into the future

July 30, 2026
Visualization tools, datasets, and resources — July 2026 roundup

July 23, 2026
Color for categories

Second Edition

Visualize This: The FlowingData Guide to Design, Visualization, and Statistics (2nd Edition)

New tools, refined process.

Order: Amazon / Bookshop

Browse by Chart Type See All →

Treemap Difference Chart Dot Map Streamgraph Dot Density Map Histogram Density Plot Word Cloud Grid Map Donut Chart

Browse By Topic

  • Visualization

    Seeing data

  • Maps

    Seeing geographic data

  • Infographics

    Explaining data

  • Networks

    Connecting data

  • Statistics

    Analyzing data

  • Software

    Working with data

  • Sources

    Getting data

  • Design

    Making data readable

Made by FlowingData

  • The Process

  • Data Underload

  • Chart Everything

  • Guides

  • Books

  • Shop

  • About
  • Contact
  • LinkedIn
  • Bluesky
  • Instagram
  • RSS
Copyright © 2007-Present FlowingData. All rights reserved.