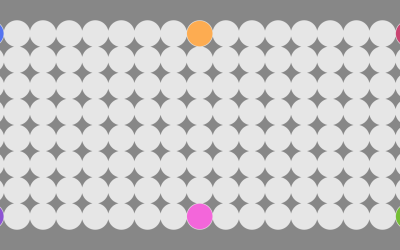
Most Common Use of Time, By Age and Sex (2015)
See the updated version of the graphic below with 2024 data here →
We saw how much time people spend on various activities during the day, and the distributions show a fair amount of variance. Sure, the average person sleeps 7 to 8 hours on an average night, but some get a lot less and others get a lot more. It’s the same way with work. However, typical time use also varies by who you talk to.
A 15-year-old spends the day differently than an adult who works full-time (obviously). You’re not going to see much of the latter spending their time on education in the middle of the day. It’s the leading activity for the former. Similarly, as you get older and pass retirement age, it’s much more likely your working hours decrease, which leaves a lot more time to get your leisure on.
See how you compare to your cohort.
The typical time thresholds apply. In the late night and early morning, most people are sleeping regardless of age and sex. Then as you shift closer to the eight o’clock hour, you see traveling move up as people commute to work and then work and work-related activities takes the top spot. The reverse happens around the five o’clock hour and people head home.
The most interesting part to me are the small shifts in activity rank when you select older ages. Sleep shifts to earlier times, leisure time stays number one for most of the day after morning household activities (more for females than males), and most retire by the 65 and older age group (67 is retirement age here in the states).
I guess as my parents travel the world and me here on my computer or chasing around a toddler, I wonder what I’m going to be doing thirty years from now.
 A Day in the Life of Americans
I used this data to simulate an average day for 1,000 people.
Chart Type Used
Become a member. Support an independent site. Get extra visualization goodness.
See What You Get