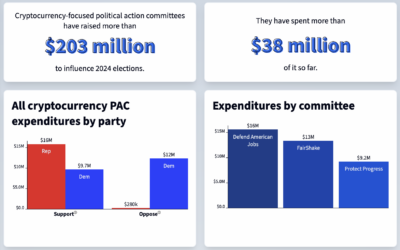
Those who run cryptocurrency companies have much to gain from policies that favor…
Statistical Visualization
Finding patterns, distributions, and anomalies.
-
Cryptocurrency-funded politics
-
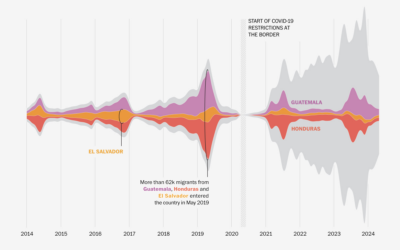
Where immigrants in the U.S. came from
A lot of immigration talk in the U.S. focuses on Mexico, but immigrants…
-
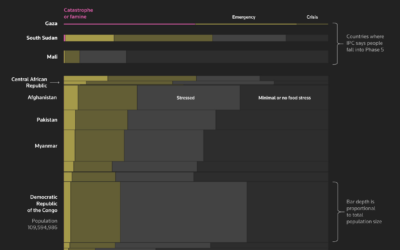
Famine prevalence in different countries
Reuters explores famine around the world through the lens of starving children in…
-
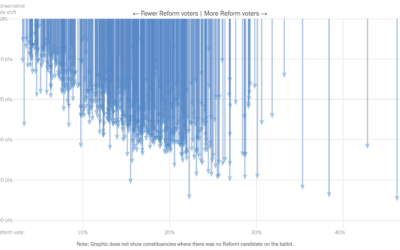
Conservatives lose UK election by a lot
For the New York Times, Josh Holder and Lauren Leatherby show how the…
-
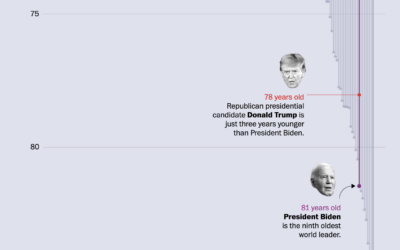
Age differences between world leaders and the populations they serve
The ages of American presidential candidates are old when compared to the ages…
-
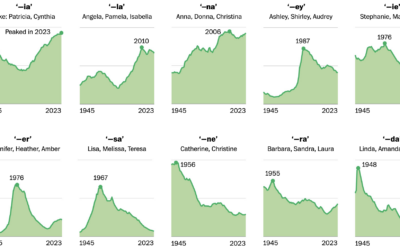
Trendy baby name sounds
For WP’s Department of Data, Daniel Wolfe analyzed baby name data with Laura…
-
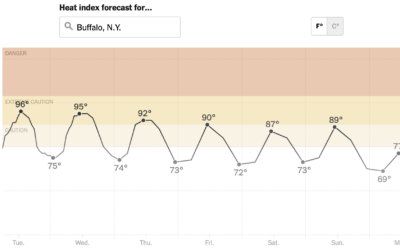
Heat tracker for the U.S.
It’s abnormally hot in a large portion of the United States, and it’s…
-
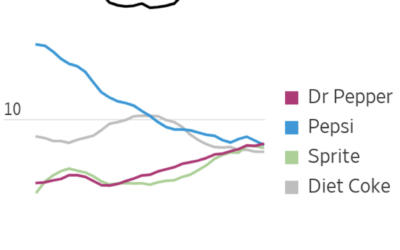
Dr Pepper ties with Pepsi-Cola for number two soda
Dr Pepper steadily rose and Pepsi steadily declined over the past couple of…
-
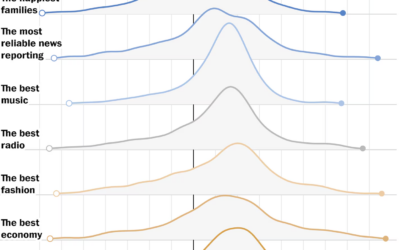
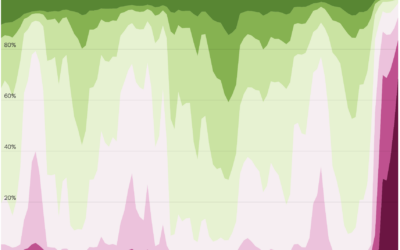
When feelings of nostalgia peak
YouGov surveyed 2,000 adults asking them when was the best and worst decades…
-
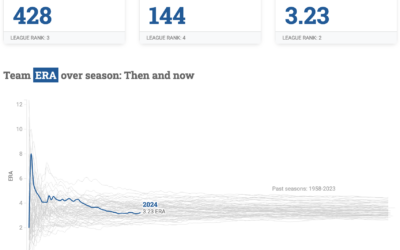
Dashboard for L.A. Dodgers baseball
To keep track of performance, Matt Stiles made the Dodgers Data Bot, which…
-
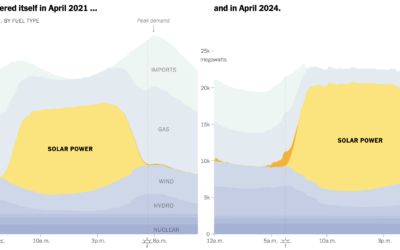
Shifting to batteries for electricity
To capture solar energy for use in the evening, batteries have grown in…
-
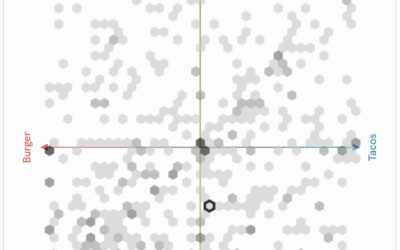
Communal Plot, a shared coordinate space to see how your taste compares
PerThirtySix made a communal plot that asks for your opinion via scatterplot and…
-
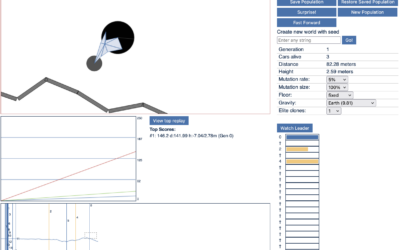
Genetic algorithm car race thingy
From the oldie-but-goodie department, this fun program uses a genetic algorithm to drive…
-
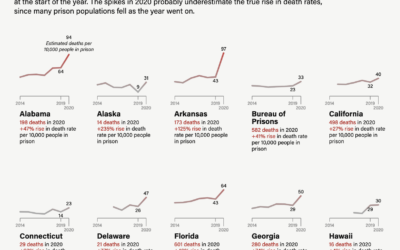
Rise in prison death rates during the pandemic
The Marshall Project highlights research on excess mortality in U.S. prisons:
The slowdown… -
Existing mortgages with lower rates than new ones
For The Upshot, Emily Badger and Francesca Paris compare the rates of existing…
-
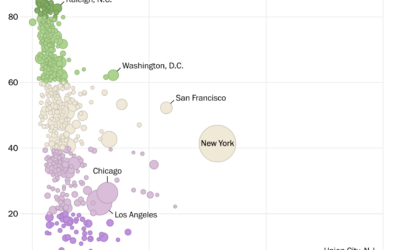
Access to nature where you live
NatureQuant processes and analyzes satellite imagery to quantify people’s access to nature. They…
-
Happiness ratings, by country and age
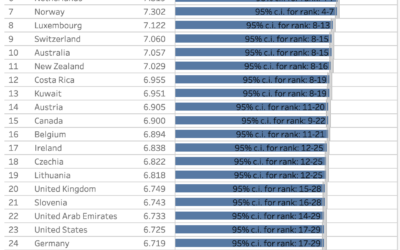
The World Happiness Report, published each year since 2012, just dropped for 2024.…
-
Racial bias in OpenAI GPT resume rankings
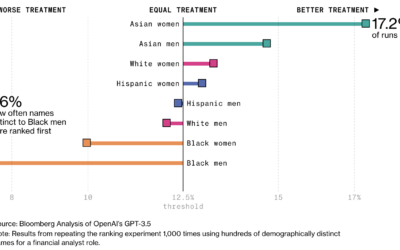
AI is finding its way into the HR workflow to sift through resumes.…

 Visualize This: The FlowingData Guide to Design, Visualization, and Statistics (2nd Edition)


