Consumer spending has shifted dramatically since most people have to stay at home.…
Statistical Visualization
Finding patterns, distributions, and anomalies.
-
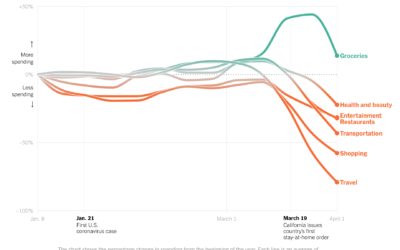
Change in consumer spending since the virus
-
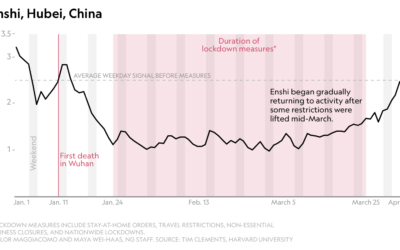
Stay-at-home orders seen through decreased seismic activity
The pandemic has affected all parts of life, which can be seen from…
-
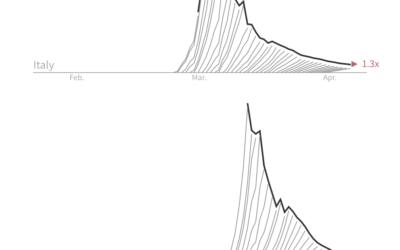
Slowing down the rate of deaths, aka breaking the wave
For Reuters, Jon McClure looks at the death counts for each country from…
-
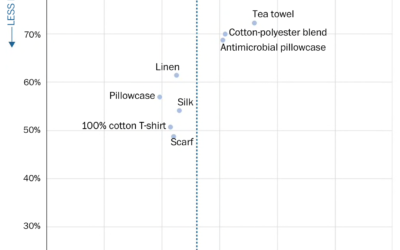
DIY masks, balancing filtration and breathability
The CDC now recommends that you wear a cloth face mask if you…
-
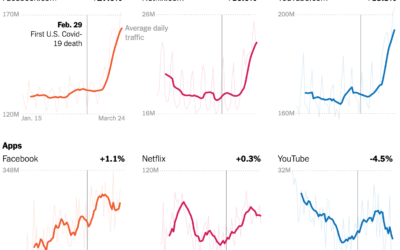
Change in internet usage since the virus
Your schedule changed. The time spent in front of or using a screen…
-
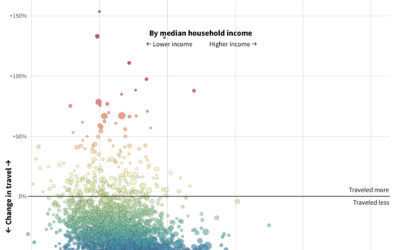
Social distancing isn’t available for everyone
For Reuters, Chris Canipe looks at social distancing from the perspective of household…
-
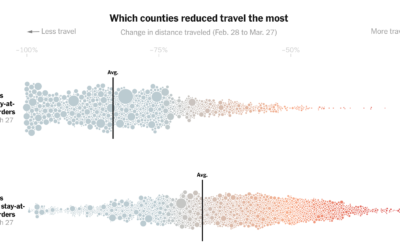
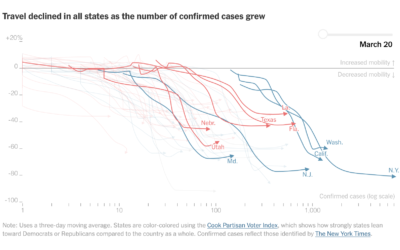
County stay-at-home orders and change in distance traveled
Based on cellphone data from Cuebiq, The New York Times looked at how…
-
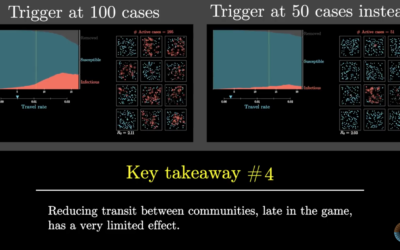
Simulating an epidemic
3Blue1Brown goes into more of the math of SIR models — which drive…
-
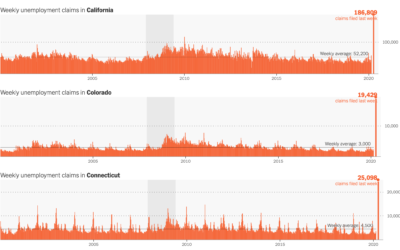
Unemployment spike
The Department of Labor released the numbers for last week’s unemployment filings. 3.28…
-
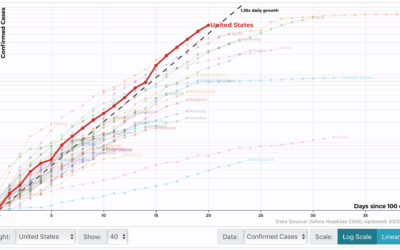
Track confirmed Covid-19 cases by country, state, and region
Wade Fagen-Ulmschneider made a set of interactive charts to track confirmed coronavirus cases.…
-
Mobile phone data shows decreased movement nationwide
Stuart A. Thompson and Yaryna Serkez for New York Times Opinion on decreasing…
-
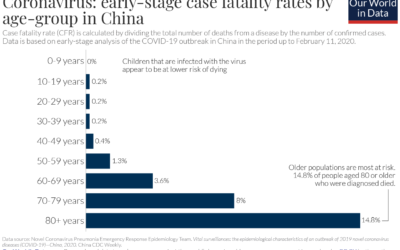
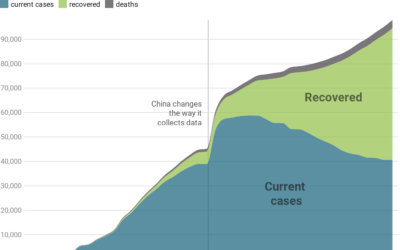
A view of the coronavirus outbreak through data
There’s a lot of figures and numbers floating around about the coronavirus disease.…
-
Flatten the coronavirus curve
The coronavirus can possibly infect a lot more people than there are those…
-
Responsible coronavirus charts
Speaking of responsible visualization, Datawrapper provides 17 charts and maps you can use…
-
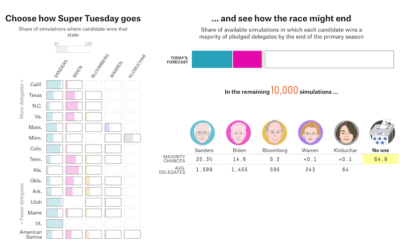
Super Tuesday simulator
With Super Tuesday on the way, there’s still a lot of uncertainty for…
-

Making invisible gas leaks visible
For The New York Times, Jonah M. Kessel and Hiroko Tabuchi went to…
-
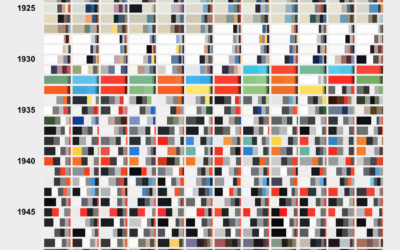
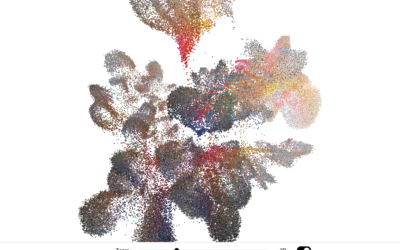
Color breakdown of Scientific American covers
For Scientific American, Nicholas Rougeux and Jen Christiansen show the shift in hues…
-
Fashion runway color palette
From Google Arts & Culture:
We came together with The Business of Fashion…
Recently for Members
Second Edition
 Visualize This: The FlowingData Guide to Design, Visualization, and Statistics (2nd Edition)
 Visualize This: The FlowingData Guide to Design, Visualization, and Statistics (2nd Edition)
New tools, refined process.
Browse by Chart Type See All →


